QUESTION 2
2.1 The following dataset contains the number of defects found on each of 12
randomly chosen bicycle frames manufactured by Luigi Bikes Inc. over a period of
two weeks:
5 7 15 9
19 8 16 16
9 5 7 10
The formula for calculating the number of classes for a histogram is as follows:
k≥log12/log2 where: n = number of data values k = the number of classes
Since there are 12 observations in the data set, we have n = 12. Therefore:
k≥log12/log2 k=4 Now, with 4 classes, the class width is:
=Range /k
= (16-4)/4 =3
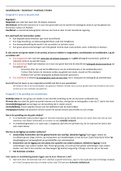
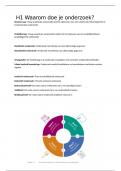
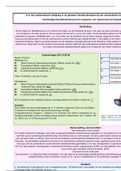
The frequency distribution is as follows:
Class Frequency
4-7 4
8-11 4
12-15 1
16-19 3
, Histogram
4.5
4
3.5
3
FREQUENCY
2.5
2
1.5
1
0.5
0
1 2 3 4
CLASS
Class Frequency
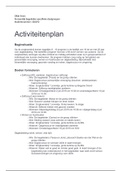
2.2 The management of Thembisa post office is concerned about the number of
customer complaints. They decide to use Pareto analysis as a first step in solving
this problem. The necessary data were collected, and the results are shown below:
Draw a Pareto chart and point out how it reflects the 80/20 principle. (4) [Hint: Use
the codes given in the table to represent the causes in the chart].
First, we order the causes according to their frequency, from largest to smallest, and
then construct a frequency table containing the frequencies, percentages, and
cumulative percentages.
Code Description Frequency Percentag Cumulative
e percentage
D Unreliable international post 62 41.3 41.3
I Poor general customer 56 37.3 78.6
service
C Inconsistent delivery times 10 6.7 85.3
B Unfriendly teller assistant 8 5.3 90.6
2.1 The following dataset contains the number of defects found on each of 12
randomly chosen bicycle frames manufactured by Luigi Bikes Inc. over a period of
two weeks:
5 7 15 9
19 8 16 16
9 5 7 10
The formula for calculating the number of classes for a histogram is as follows:
k≥log12/log2 where: n = number of data values k = the number of classes
Since there are 12 observations in the data set, we have n = 12. Therefore:
k≥log12/log2 k=4 Now, with 4 classes, the class width is:
=Range /k
= (16-4)/4 =3
The frequency distribution is as follows:
Class Frequency
4-7 4
8-11 4
12-15 1
16-19 3
, Histogram
4.5
4
3.5
3
FREQUENCY
2.5
2
1.5
1
0.5
0
1 2 3 4
CLASS
Class Frequency
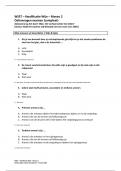
2.2 The management of Thembisa post office is concerned about the number of
customer complaints. They decide to use Pareto analysis as a first step in solving
this problem. The necessary data were collected, and the results are shown below:
Draw a Pareto chart and point out how it reflects the 80/20 principle. (4) [Hint: Use
the codes given in the table to represent the causes in the chart].
First, we order the causes according to their frequency, from largest to smallest, and
then construct a frequency table containing the frequencies, percentages, and
cumulative percentages.
Code Description Frequency Percentag Cumulative
e percentage
D Unreliable international post 62 41.3 41.3
I Poor general customer 56 37.3 78.6
service
C Inconsistent delivery times 10 6.7 85.3
B Unfriendly teller assistant 8 5.3 90.6