Verbeter je zoekresultaten. Selecteer je onderwijsinstelling en vak zodat wij jou de meest relevante documenten kunnen laten zien en jij het beste geholpen wordt!
Oké, ik begrijp het!
Jouw school of universiteit
Verbeter je zoekresultaten. Selecteer je onderwijsinstelling en vak zodat wij jou de meest relevante documenten kunnen laten zien en jij het beste geholpen wordt!
Hier vind je de beste samenvattingen om te slagen voor Business Analytics_ Data Analysis _. Er zijn o.a. samenvattingen, aantekeningen en oefenvragen beschikbaar.
Chapter 5:Business Analytics_ Data Analysis _ Decision Making 5th Edition Albright
Tentamen (uitwerkingen) • 16
pagina's
• 2020
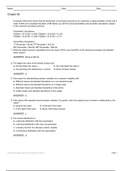
A popular retail store knows that the distribution of purchase amounts by its customers is approximately normal with a
mean of $30 and a standard deviation of $9. Below you will find normal probability and percentile calculations related
to the customer purchase amounts.
Probability Calculations
P(Sales < $ 15.00) = 0.048, P(Sales < $ 20.00) = 0.133,
P(Sales < $ 25.00) = 0.289, P(Sales < $ 35.00) = 0.711
Percentiles Calculations
1st Percentile = $9.06, 5th Percentile = $15.20,
95th P...
Chapter 5:Business Analytics_ Data Analysis _ Decision Making 5th Edition Albright
Laatste update van het document:
geleden
A popular retail store knows that the distribution of purchase amounts by its customers is approximately normal with a
mean of $30 and a standard deviation of $9. Below you will find normal probability and percentile calculations related
to the customer purchase amounts.
Probability Calculations
P(Sales < $ 15.00) = 0.048, P(Sales < $ 20.00) = 0.133,
P(Sales < $ 25.00) = 0.289, P(Sales < $ 35.00) = 0.711
Percentiles Calculations
1st Percentile = $9.06, 5th Percentile = $15.20,
95th P...
Maak studiestress minder vervelend
Studiestress? Voor verkopers op Stuvia zijn dit juist gouden tijden. KA-CHING! Verdien ook aan je samenvattingen en begin nu met uploaden.
Ontdek alles over verdienen op Stuvia