Table of Contents
INTRODUCTION ...................................................................................................................... 2
Details of the approach: ........................................................................................................ 2
Preparing Data ........................................................................................................................ 2
Data Visualiza+on: ......................................................................................................................................... 5
Selec+on:..................................................................................................................................................... 11
Random Forest: ........................................................................................................................................... 15
Results Analysis: ........................................................................................................................19
Discussion and conclusions:.......................................................................................................19
,INTRODUCTION
The Titanic disaster, which resulted in the loss of many lives, is a widely recognized historical
event. This undertaking aims to utilize classification techniques with the Titanic dataset to
estimate the passengers' survival rate. To achieve this goal, we will divide the task into smaller
tasks, starting with data pre-processing, cleaning, normalization, visualization, and feature
extraction/selection. Finally, we will utilize classification models to predict the survival rate.
Details of the approach:
Our project will use the Python programming language and established libraries such as
pandas, NumPy, Matplotlib, and scikit-learn. Initially, we will import the Titanic dataset and
perform data pre-processing and cleaning to eliminate any duplicates or missing data. The
data will be normalized, which will enhance the performance of the classification models by
ensuring that each feature has a comparable scale. Next, we will conduct data analysis and
visualization to gain insight into the data and identify any patterns that might assist in predicting
the survival rate. Following that, we will employ feature extraction and selection to identify the
most relevant characteristics that are strongly correlated with the target variable.
Preparing Data
df = pd.read_csv("/kaggle/input/titanicdata/TitanicData.csv")
The following code reads a CSV file from the directory
("/kaggle/input/titanicdata/TitanicData.csv") utilizing the pandas library and stores its
contents in a pandas DataFrame object named df. The CSV file is likely to contain the
training set of the Titanic dataset, which includes information on the passengers aboard the
Titanic.
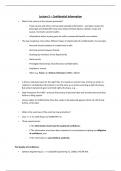
df.describe()
The code snippet commands the pandas DataFrame object, df, to execute the describe()
function. This method generates a summary of statistical measures for the numerical
columns present in the DataFrame, including count, mean, standard deviation, minimum and
maximum values. The output of this function is a table that presents these summary
statistics for each numerical column in the DataFrame.
This code reads and summarizes the Titanic dataset, providing sta5s5cal informa5on on the
numerical characteris5cs of the dataset's training set.
2
, df.isnull()
This code generates a boolean DataFrame with the same shape as df, where a True value
indicates that the cell is null (NaN), and a False value indicates that the cell contains a value.
As a result, the resulting DataFrame contains True values for missing values and False
values for all other cells.
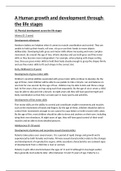
df.isnull().sum()
This code tallies the number of null values in each column of a pandas DataFrame. This
information can be useful in identifying which columns have null values and how many null
values there are in each column.
3
INTRODUCTION ...................................................................................................................... 2
Details of the approach: ........................................................................................................ 2
Preparing Data ........................................................................................................................ 2
Data Visualiza+on: ......................................................................................................................................... 5
Selec+on:..................................................................................................................................................... 11
Random Forest: ........................................................................................................................................... 15
Results Analysis: ........................................................................................................................19
Discussion and conclusions:.......................................................................................................19
,INTRODUCTION
The Titanic disaster, which resulted in the loss of many lives, is a widely recognized historical
event. This undertaking aims to utilize classification techniques with the Titanic dataset to
estimate the passengers' survival rate. To achieve this goal, we will divide the task into smaller
tasks, starting with data pre-processing, cleaning, normalization, visualization, and feature
extraction/selection. Finally, we will utilize classification models to predict the survival rate.
Details of the approach:
Our project will use the Python programming language and established libraries such as
pandas, NumPy, Matplotlib, and scikit-learn. Initially, we will import the Titanic dataset and
perform data pre-processing and cleaning to eliminate any duplicates or missing data. The
data will be normalized, which will enhance the performance of the classification models by
ensuring that each feature has a comparable scale. Next, we will conduct data analysis and
visualization to gain insight into the data and identify any patterns that might assist in predicting
the survival rate. Following that, we will employ feature extraction and selection to identify the
most relevant characteristics that are strongly correlated with the target variable.
Preparing Data
df = pd.read_csv("/kaggle/input/titanicdata/TitanicData.csv")
The following code reads a CSV file from the directory
("/kaggle/input/titanicdata/TitanicData.csv") utilizing the pandas library and stores its
contents in a pandas DataFrame object named df. The CSV file is likely to contain the
training set of the Titanic dataset, which includes information on the passengers aboard the
Titanic.
df.describe()
The code snippet commands the pandas DataFrame object, df, to execute the describe()
function. This method generates a summary of statistical measures for the numerical
columns present in the DataFrame, including count, mean, standard deviation, minimum and
maximum values. The output of this function is a table that presents these summary
statistics for each numerical column in the DataFrame.
This code reads and summarizes the Titanic dataset, providing sta5s5cal informa5on on the
numerical characteris5cs of the dataset's training set.
2
, df.isnull()
This code generates a boolean DataFrame with the same shape as df, where a True value
indicates that the cell is null (NaN), and a False value indicates that the cell contains a value.
As a result, the resulting DataFrame contains True values for missing values and False
values for all other cells.
df.isnull().sum()
This code tallies the number of null values in each column of a pandas DataFrame. This
information can be useful in identifying which columns have null values and how many null
values there are in each column.
3