MACROECONOMICS 1
SUMMARY NOTES
CHAPTER 1 – INTRODUCTION
1.1 AN INTRODUCTION TO ECONOMICS
Macroeconomics helps to deepen our understanding of wider economic changes within and
across society
• It helps us understand the driving factors of economic change
The macroeconomic issues/concerns:
• Output and income
• Economic growth
• Unemployment
• Inflation
• International trade
Aggregated variable – average value / economy wide level
Roles of macroeconomists:
• Communicate the economy to non-specialists
• Study relationships between macroeconomic variables
• Invent new theories
1.2 MACROECONOMIC TIME SERIES
Public office of national statistics
• Responsible for the construction and measurement of macroeconomic variables
over time
o Measured using statistical technology and collating information to produce
the best estimates every time
TIME SERIES DATA – A series of observations from a macroeconomic variable,
constructed/collected by the ONS. Data is in the form of a level, index, or
percentage.
PELIMINARY DATA ANALYSIS – An analysis/visual representation that comes from
the observation of a basic presentation of economic data
Plotting economic data:
• Horizontal – variable of time
• Vertical – variable of interest
• How jagged the graph is dependent on how often data is collected
o More frequent = less smooth
, Preliminary data analysis:
• The facts require proof through economic reasoning
• Can draw some basic economic inference using visual inspection
1.3 ECONOMIC MODELLING
Economic modelling is miniature representations of shocks to the economy and economic
policy
Three types of models:
• Descriptive model (understanding)
• Diagrammatic (visualisation)
• Mathematical (can be tested)
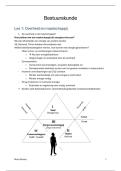
Simplified models are more useful because they eliminate unnecessary details.
• Tend to be 2D with two schedules
o Vertical – adjusting mechanism
o Horizontal – variable of interest
• If both schedules act the same at a value, the market clears, creating a state of
equilibrium
CETERIS PARIBUS – factors outside the analysis stay
constant
EXOGENOUS – changes that occur outside the market
STATIC – no changes in time
CHAPTER 2 MACROECONOMIC VARIABLES PART 1
2.1 INTRODUCTION
Causation:
• Even though higher incomes and higher wellbeing tend to co-exist, on does not
necessarily cause the other
• Rising prices may look like the economy is growing, as the value for economic
transactions appears to be growing
o However, it may purely be inflation, and not an increase in real economic
activity
2.2 NATIONAL INCOME, OUTPUT AND EXPENDITURE
The sum of the value-added revenues of The sum of all money earnt from
firms in the economy AKA output or AS transactions
Production = Expenditure = Income
The sum of all money that is spent
,Gross Domestic Product (GDP)
• Gross – measured using market prices
• Domestic – includes only home production
o Includes production of ‘foreign owned’ firms based in the domestic country
(our country)
Ways of calculating GDP:
• Production method
• Expenditure method
• Income method
Production method:
• Final goods approach
• Value added approach
o Sums up all the value that every firm adds to the chain of production in the
economy
• GDP also included production from institutions where goods and services are not
sold at market price
o Including the sale of goods from intermediaries to final goods producers
o So, value added approach is more useful
o Problem of double counting
2.3 ECONOMIC GROWTH
Measuring economic growth
• Economic growth can be measured using the percentage change in GDP over a
period
• Positive economic growth is an indication of good health in an economy
o Increases in output and employment can be expected
LR:
• LR policies tend to have fewer undesirable effects than SR policies
• A policymaker has an ‘average rate/ benchmark to gauge the performance of the
economy between periods
o Aim for this in the LR
o React with SR economic policy when growth is away from its normal rate
• Normal rate of growth – an expectation of the growth rate over the LR time horizon.
Can be changed by:
o Permanent shock
o Economy developing
o Changes in general level of competitiveness
Supply side policies:
• Renowned for affecting the LR rate of growth
• Examples:
o Decreasing corporation tax
o Infrastructure investment
o Decrease employment regulations
o Innovation grants
Demand side policies
, • Examples:
o Changing government expenditure
o Changing money supply
o Changing taxation
• Economic slack increases/decreases as the economy moves towards/away from its
maximum capacity
Economic fluctuations in the SR:
• Movements away from the natural rates in the economy
• Business cycle is oscillating pattern of these
o Shows regular and prolonged periods of growth, booms, and recessions every
10 years or so
• To react, the government can use demand side policies
FISCAL POLICY – changes in government expenditure
MONETARY POLICY – change in the money supply
CHAPTER 3
3.1 INTRODUCTION
Most closely followed indicators:
1. Unemployment rate
o Directly reflects wellbeing and condition of workers in the economy
2. Inflation rate
o A sudden increase in prices creates uncertainty
3. Exchange rate
o Makes domestically produced goods more expensive aboard so weakens
revenues of nations exporting products
1 – 3 (most to least important)
3.2 UNEMPLOYMENT
• Unemployed doesn’t include those who have left the workforce or aren’t actively
seeking jobs
o This risks mismeasurement of the unemployed
UNEMPLOYED – the number of people willing and able to work but without work
THE WORKING AGE POPULATION – the set of individuals between the legal age of
starting work and the age of retirement
THE WORKFORCE – the subset of the working age population willing and able to work at
the current wage
THE STYLSED FACT – the facts we see reflected by the macroeconomic data
• Can contain contamination (from effects of other variables at different
points in time)
• Output and unemployment are closely and negatively related
• A decrease in unemployment is positive for economic and social wellbeing
SUMMARY NOTES
CHAPTER 1 – INTRODUCTION
1.1 AN INTRODUCTION TO ECONOMICS
Macroeconomics helps to deepen our understanding of wider economic changes within and
across society
• It helps us understand the driving factors of economic change
The macroeconomic issues/concerns:
• Output and income
• Economic growth
• Unemployment
• Inflation
• International trade
Aggregated variable – average value / economy wide level
Roles of macroeconomists:
• Communicate the economy to non-specialists
• Study relationships between macroeconomic variables
• Invent new theories
1.2 MACROECONOMIC TIME SERIES
Public office of national statistics
• Responsible for the construction and measurement of macroeconomic variables
over time
o Measured using statistical technology and collating information to produce
the best estimates every time
TIME SERIES DATA – A series of observations from a macroeconomic variable,
constructed/collected by the ONS. Data is in the form of a level, index, or
percentage.
PELIMINARY DATA ANALYSIS – An analysis/visual representation that comes from
the observation of a basic presentation of economic data
Plotting economic data:
• Horizontal – variable of time
• Vertical – variable of interest
• How jagged the graph is dependent on how often data is collected
o More frequent = less smooth
, Preliminary data analysis:
• The facts require proof through economic reasoning
• Can draw some basic economic inference using visual inspection
1.3 ECONOMIC MODELLING
Economic modelling is miniature representations of shocks to the economy and economic
policy
Three types of models:
• Descriptive model (understanding)
• Diagrammatic (visualisation)
• Mathematical (can be tested)
Simplified models are more useful because they eliminate unnecessary details.
• Tend to be 2D with two schedules
o Vertical – adjusting mechanism
o Horizontal – variable of interest
• If both schedules act the same at a value, the market clears, creating a state of
equilibrium
CETERIS PARIBUS – factors outside the analysis stay
constant
EXOGENOUS – changes that occur outside the market
STATIC – no changes in time
CHAPTER 2 MACROECONOMIC VARIABLES PART 1
2.1 INTRODUCTION
Causation:
• Even though higher incomes and higher wellbeing tend to co-exist, on does not
necessarily cause the other
• Rising prices may look like the economy is growing, as the value for economic
transactions appears to be growing
o However, it may purely be inflation, and not an increase in real economic
activity
2.2 NATIONAL INCOME, OUTPUT AND EXPENDITURE
The sum of the value-added revenues of The sum of all money earnt from
firms in the economy AKA output or AS transactions
Production = Expenditure = Income
The sum of all money that is spent
,Gross Domestic Product (GDP)
• Gross – measured using market prices
• Domestic – includes only home production
o Includes production of ‘foreign owned’ firms based in the domestic country
(our country)
Ways of calculating GDP:
• Production method
• Expenditure method
• Income method
Production method:
• Final goods approach
• Value added approach
o Sums up all the value that every firm adds to the chain of production in the
economy
• GDP also included production from institutions where goods and services are not
sold at market price
o Including the sale of goods from intermediaries to final goods producers
o So, value added approach is more useful
o Problem of double counting
2.3 ECONOMIC GROWTH
Measuring economic growth
• Economic growth can be measured using the percentage change in GDP over a
period
• Positive economic growth is an indication of good health in an economy
o Increases in output and employment can be expected
LR:
• LR policies tend to have fewer undesirable effects than SR policies
• A policymaker has an ‘average rate/ benchmark to gauge the performance of the
economy between periods
o Aim for this in the LR
o React with SR economic policy when growth is away from its normal rate
• Normal rate of growth – an expectation of the growth rate over the LR time horizon.
Can be changed by:
o Permanent shock
o Economy developing
o Changes in general level of competitiveness
Supply side policies:
• Renowned for affecting the LR rate of growth
• Examples:
o Decreasing corporation tax
o Infrastructure investment
o Decrease employment regulations
o Innovation grants
Demand side policies
, • Examples:
o Changing government expenditure
o Changing money supply
o Changing taxation
• Economic slack increases/decreases as the economy moves towards/away from its
maximum capacity
Economic fluctuations in the SR:
• Movements away from the natural rates in the economy
• Business cycle is oscillating pattern of these
o Shows regular and prolonged periods of growth, booms, and recessions every
10 years or so
• To react, the government can use demand side policies
FISCAL POLICY – changes in government expenditure
MONETARY POLICY – change in the money supply
CHAPTER 3
3.1 INTRODUCTION
Most closely followed indicators:
1. Unemployment rate
o Directly reflects wellbeing and condition of workers in the economy
2. Inflation rate
o A sudden increase in prices creates uncertainty
3. Exchange rate
o Makes domestically produced goods more expensive aboard so weakens
revenues of nations exporting products
1 – 3 (most to least important)
3.2 UNEMPLOYMENT
• Unemployed doesn’t include those who have left the workforce or aren’t actively
seeking jobs
o This risks mismeasurement of the unemployed
UNEMPLOYED – the number of people willing and able to work but without work
THE WORKING AGE POPULATION – the set of individuals between the legal age of
starting work and the age of retirement
THE WORKFORCE – the subset of the working age population willing and able to work at
the current wage
THE STYLSED FACT – the facts we see reflected by the macroeconomic data
• Can contain contamination (from effects of other variables at different
points in time)
• Output and unemployment are closely and negatively related
• A decrease in unemployment is positive for economic and social wellbeing