- Study guides, Class notes & Summaries
Looking for the best study guides, study notes and summaries about ? On this page you'll find 10 study documents about .
All 10 results
Sort by:
-
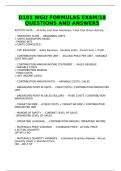
Exam (elaborations)
Probability and Statistics, WGU C955 Latest Update 2024-2025 Exam Questions and 100% Verified Correct Answers Guaranteed A+
-
$20.99
 Tutordiligent
-
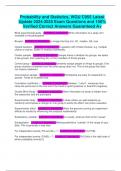
Exam (elaborations)
Probability and Statistics, WGU C955 | 51 Questions and answers with 100% correct solutions | Graded A+
-
$8.99
 FLYINGCOLORS
-
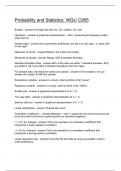
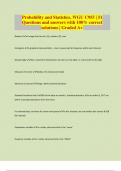
Exam (elaborations)
Probability and Statistics, WGU C955 Questions & Answers (Graded A)
-
$10.49
nursingismylife
-
Package deal
WGU into to probability and statistics Exam Bundle Questions and Answers 100% Verified
-
$23.39
 IMORA
IMORA