- Study guides, Class notes & Summaries
Looking for the best study guides, study notes and summaries about ? On this page you'll find 4 study documents about .
All 4 results
Sort by

-
MATH110 STATISTICS FINAL EXAM: PORTAGE LEARNING ACTUAL EXAM UPDATED 2024 GRADED A+
- Exam (elaborations) • 9 pages • 2024
- $17.99
- + learn more
MATH110 STATISTICS FINAL EXAM: PORTAGE LEARNING ACTUAL EXAM UPDATED 2024 GRADED A+ MATH110 STATISTICS FINAL EXAM: PORTAGE LEARNING ACTUAL EXAM UPDATED 2024 GRADED A+ MATH110 STATISTICS FINAL EXAM: PORTAGE LEARNING ACTUAL EXAM UPDATED 2024 GRADED A+
-
MATH110 STATISTICS FINAL EXAM: PORTAGE LEARNING ACTUAL EXAM UPDATED 2024 GRADED A+
- Exam (elaborations) • 9 pages • 2024
- $18.99
- 1x sold
- + learn more
MATH110 STATISTICS FINAL EXAM: PORTAGE LEARNING ACTUAL EXAM UPDATED 2024 GRADED A+ MATH110 STATISTICS FINAL EXAM: PORTAGE LEARNING ACTUAL EXAM UPDATED 2024 GRADED A+ MATH110 STATISTICS FINAL EXAM: PORTAGE LEARNING ACTUAL EXAM UPDATED 2024 GRADED A+
-
MATH 110 Final Exam (New-2023) / MATH110 Final Exam/ MATH 110 Statistics Final Exam/ MATH110 Statistics Final Exam: Portage Learning (Already graded A+)
- Exam (elaborations) • 8 pages • 2023
- $14.99
- + learn more
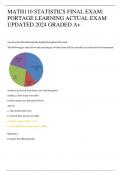
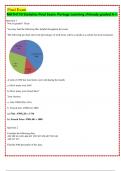
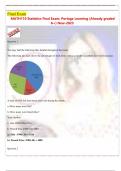
xam MATH110 Statistics Final Exam: Portage Learning (Already graded A+) Question 1 Not yet graded / 10 pts You may find the following files helpful throughout the exam: The following pie chart shows the percentages of total items sold in a month in a certain fast food restaurant. A total of 4700 fast food items were sold during the month. a.) How many were fish? b.) How many were french fries? Your Answer: a. fish 4700(0.28)=1316 b. French fries 4700(0.4)=1880 a.) Fish : 47...
-
MATH 110 Final Exam (New-2023) / MATH110 Final Exam/ MATH 110 Statistics Final Exam/ MATH110 Statistics Final Exam: Portage Learning (Already graded A+)
- Exam (elaborations) • 9 pages • 2023
- $14.49
- + learn more
Final Exam MATH110 Statistics Final Exam: Portage Learning (Already graded A+) New-2023 Question 1 You may find the following files helpful throughout the exam: The following pie chart shows the percentages of total items sold in a month in a certain fast food restaurant. A total of 4700 fast food items were sold during the month. a.) How many were fish? b.) How many were french fries? Your Answer: a. fish 4700(0.28)=1316 b. French fries 4700(0.4)=1880 a.) Fish : 4700(...

Want to regain your expenses?

