

MATH 533 (MATH533)
Devry University
Here are the best resources to pass MATH 533 (MATH533). Find MATH 533 (MATH533) study guides, notes, assignments, and much more.
Other
Week 2: Course Project Part A Exploratory Data Analysis
Data Analysis The first variable is location; it is a categorical variable (Qualitative Data). The three subcategories are Urban, Suburban, and Rural. Hence, this variable is a categorical variable, the measures of central tendency and descriptive statistics has not been calculated for this variable. The frequency distribution and pie chart are given as follows: Urban Suburban Rural 5
 greatsolutions
Exam (elaborations)
MATH533_Final_Exam_Study_Guide
Popular1. The Final Exam is open book and open notes. The maximum time you can spend in the exam is 3 hours, 30 minutes. If you have not clicked the Submit for Grading button by then, you will be exited from the exam automatically. In the Final Exam environment, the Windows clipboard is disabled, so you will not be able to copy exam questions or answers to or from other applications. 2. You should click the Save Answers button in the exam frequently. This helps prevent connection timeouts that mig...
 Studygreatsolutions

Package deal
MATH 533 Course Project Part C Regression Model | MATH 533: Applied Managerial Statistics Course Project –Part A 2023 | MATH 533 Applied Managerial Statistics: Course Project Part C 2023 & MATH 533 Course Project Part B, Hypothesis Testing
MATH 533 Course Project Part C Regression Model | MATH 533: Applied Managerial Statistics Course Project –Part A 2023 | MATH 533 Applied Managerial Statistics: Course Project Part C 2023 & MATH 533 Course Project Part B, Hypothesis Testing
 DRBRIGHT2026

Package deal
MATH 533 Course Project Part C Regression Model Keller 2023 | MATH 533: Applied Managerial Statistics Course Project –Part A 2023 | MATH 533 Week 7 Course Project Part C Regression and Correlation Analysis & ATH 533 Course Project Part B, Hypothesis Testi
MATH 533 Course Project Part C Regression Model Keller 2023 | MATH 533: Applied Managerial Statistics Course Project –Part A 2023 | MATH 533 Week 7 Course Project Part C Regression and Correlation Analysis & ATH 533 Course Project Part B, Hypothesis Testing
 ExcelAcademia2026
Exam (elaborations)
Keller MATH 533 Course Project Part B, Hypothesis Testing
Keller MATH 533 Course Project Part B, Hypothesis Testing. Keller MATH 533 Course Project Part B, Hypothesis TestingRequirement A: The average (mean) sales per week exceeds 41.5 per salesperson. Key Statistics as computed by Minitab Variable N N* Mean SE Mean StDev Minimum Q1 Median Q3 SALES 100 0 42.340 0.417 4.171 32.000 39.250 42.000 45.000 N for Variable Maximum Range IQR Mode Mode SALES 52.000 20.000 5.750 44 12 Step 1 Hypotheses Ho: μ = 41.5 Ha: μ > 41.5 Step 2 Level of Sig...
ExcelAcademia2026
Exam (elaborations)
MATH 533: Applied Managerial Statistics Course Project –Part A 2023
MATH 533: Applied Managerial Statistics Course Project –Part A 2023. SALESCALL Inc. is a company with thousands of salespeople. The data provided; SALES (the number of sales made this week), CALLS (the number of sales calls made this week), TIME (the average time per call this week), YEARS (years of experience in the call center) and TYPE (the type of training, either group training, online training of no training). The data is used to determine the most productive sales person. With this ...
 STUDYLAB2023
Exam (elaborations)
MATH 533 Course Project Part C Regression Model Keller 2023
MATH 533 Course Project Part C Regression Model Keller 2023. The regression analysis is telling us that for each additional call sales will go up by 0.202. Minitab Result Regression Analysis: SALES versus CALLS (Appendix II) The regression equation is SALES = 9.64 + 0.202 CALLS Math 3 3. The correlation coefficient between sales and calls is calculated as 0.871. This positive correlation coefficient tells us that as the number of calls increase so does the number of sales. Correlation: ...
STUDYLAB2023

Exam (elaborations)
Keller MATH 533 Course Project Part B, Hypothesis Testing
Keller MATH 533 Course Project Part B, Hypothesis Testing. Hypotheses testing involves the testing of the null hypothesis and the alternative hypothesis. When testing the hypothesis either the null hypothesis or the alternative hypotheses is rejected. The value to a company knowing to accept or reject a hypothesis will aid in the decision making process. Information derived from hypothesis testing can aid in more timely decision. Requirement A: The average (mean) sales per week exceeds 41.5...
STUDYLAB2023
Exam (elaborations)
MATH 533 Course Project Part B, Hypothesis Testing
MATH 533 Course Project Part B, Hypothesis Testing. Hypotheses testing involves the testing of the null hypothesis and the alternative hypothesis. When testing the hypothesis either the null hypothesis or the alternative hypotheses is rejected. The value to a company knowing to accept or reject a hypothesis will aid in the decision making process. Information derived from hypothesis testing can aid in more timely decision. Requirement A: The average (mean) sales per week exceeds 41.5 per sa...
DRBRIGHT2026
Exam (elaborations)
MATH533_Final_Exam_Study_Guide|MATH533 Applied Managerial Statistics Final Exam Study Guide
1. The Final Exam is open book and open notes. The maximum time you can spend in the exam is 3 hours, 30 minutes. If you have not clicked the Submit for Grading button by then, you will be exited from the exam automatically. In the Final Exam environment, the Windows clipboard is disabled, so you will not be able to copy exam questions or answers to or from other applications. 2. You should click the Save Answers button in the exam frequently. This helps prevent connection timeouts that mig...
greatsolutions
Exam (elaborations)
MATH533_Final_Exam_Study_Guide Helpful Unhelpful
The Final Exam questions are pooled. This means that not everyone will have the same questions. Even if you do have some of the same questions, they may not be in the same order. These questions are distributed among the TCOs. The entire exam is worth 250 points. 8. Some of the key study areas are shown below. Although these are key areas, remember that the exam is comprehensive for all of the assigned course content and this study guide may not be allinclusive. TCO A o Descriptive Sta...
 Havilah
Exam (elaborations)
MATH 533 - Week 1 Quiz.
MATH 533 - Week 1 Quiz/MATH 533 - Week 1 Quiz.
 GOALS
GOALS
Exam (elaborations)
MATH 533 -Final Exam Ultimate.
MATH 533 -Final Exam Ultimate/MATH 533 -Final Exam Ultimate
GOALS
Exam (elaborations)
MATH 533 Week 6 Homework Problems
MATH 533 Week 6 Homework Problems Thanks for rating! Rate 4 more documents to earn a free unlock. Is this document missing answers?
Havilah
Other
MATH 533 Week 6 Course Project Part B Hypothesis Testing
Running Head: Course Project Part-B Math-533 Hypothesis Testing By: Sagar Patel Professor: Terrance Encalarde Keller Graduate School of Management June 10th, 2017 Running Head: Course Project Part-B A hypothesis testing involves the testing of the null hypothesis and the alternative hypothesis. When testing the hypothesis, either the null hypothesis or the alternative hypotheses is rejected. The Company can use hypothesis testing to examine if it should keep a current process, change ...
Havilah
Essay
Math 533 Week 7 Course Project VERY CORRECT
Math 533 Week 7 Course Project C The scatterplot graph (appendix) signifies the relationship of income and credit balance. There is a positive relationship between the income ($1,000) and the credit balance. There is a direct correlation of the credit balance increasing as the income also increases. Due to the best fit line, the graph shows that there are some incomes that will be below this line that will also have a high credit line. This would propose that there are some additional fact...
Havilah

Exam (elaborations)
MATH 533 Week 7 Course Project Part C Regression and Correlation Analysis
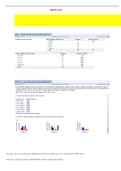
Running Head: Course Project Part C Regression Model MATH – 533 - 60846 Ans .1 Minitab Result Regression Analysis: Sales versus Calls Math 2 The regression equation is Sales = 9.638 + 0.2018 Calls 120 130 140 150 160 170 180 190 200 210 55 50 45 40 35 30 S 2.05708 R-Sq 75.9% R-Sq(adj) 75.7% Calls Sales Fitted LinePlot Sales= 9.638 + 0.2018 Calls It is evident with the help of scatter graph trend line that there is positive relationship between Sales and calls. If numbe...
Havilah
Exam (elaborations)
MATH 533 Week 1 Homework Problems (GRADED A) Questions and Answer Solution | Download To Score An A
MATH 533 Week 1 Homework Problems (GRADED A) Questions and Answer Solution | Download To Score An A
 Lectlincon

Exam (elaborations)
MATH 533 Project Part A With Complete Solution
MATH 533 Project Part A With Complete Solution
 Wiseman