
MATH 534 APPLIED MANAGERIAL STATISTICS (MATH534)
Devry University
Here are the best resources to pass MATH 534 APPLIED MANAGERIAL STATISTICS (MATH534). Find MATH 534 APPLIED MANAGERIAL STATISTICS (MATH534) study guides, notes, assignments, and much more.
Exam (elaborations)
MATH 534 APPLIED MANAGERIAL STATISTICS Week 7 Course Project Part C: Regression and Correlation Analysis.
MATH 534 APPLIED MANAGERIAL STATISTICS Week 7 Course Project Part C: Regression and Correlation Analysis. 1. Generate a scatterplot for the specified dependent variable (Y) and the X1 independent variable, including the graph of the "best fit" line. Interpret. Fitted Plot Line 0 20 40 60 80 100 120 140 0 10 20 30 40 50 60 According to the Graph the linear relationship there is a positive relationship between Sales and calls. If number of calls increases the sales also increase an...
 Tutorexpert01
Exam (elaborations)
MATH 534 APPLIED MANAGERIAL STATISTICS Week 7 Course Project Part C: Regression and Correlation Analysis.
MATH 534 APPLIED MANAGERIAL STATISTICS Week 7 Course Project Part C: Regression and Correlation Analysis. COURSE PROJECT: PART C 2 1. Generate a scatterplot for the specified dependent variable (Y) and the X1 independent variable, including the graph of the "best fit" line. Interpret. Fitted Plot Line 0 20 40 60 80 100 120 140 0 10 20 30 40 50 60 According to the Graph the linear relationship there is a positive relationship between Sales and calls. If number of calls increases...
 DoctorReinhad
Exam (elaborations)
MATH 534 Week 7 Course Project Part C: Regression and Correlation Analysis (Summer 2019)
Table of Contents Summary Report Sales is the driving force behind any economy, no matter where on the planet one resides. Therefore, in most businesses, it is pertinent to the success and lifespan of the company to track the number of sales. In this analysis, we chose three independent variables to produce a model that would be able to predict the number of sales in a given equation. Assuming the population mean to be unknown, we collected a random sample of 100 data points of sales with r...
 EvaTee
Package deal
MATH 534 Applied Managerial Statistics Course Bundle
MATH 534 Applied Managerial Statistics Course Bundle
 grademaster
Exam (elaborations)
MATH 534 Week 7 Course Project Part C: Regression and Correlation Analysis.
MATH 534 Week 7 Course Project Part C: Regression and Correlation Analysis.Sales is the driving force behind any economy, no matter where on the planet one resides. Therefore, in most businesses, it is pertinent to the success and lifespan of the company to track the number of sales. In this analysis, we chose three independent variables to produce a model that would be able to predict the number of sales in a given equation. Assuming the population mean to be unknown, we collected a random sam...
grademaster
Exam (elaborations)
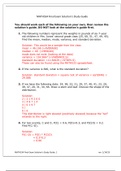
MATH534 Final Exam Solution’s Study Guide solution with answers 2020 docs
MATH534 Final Exam Solution’s Study Guide solution with answers 2020 docs You should work each of the following on your own, thenreview the solution’s guide. DO NOT look at the solution’s guidefirst. 1. The following numbers represent the weights in pounds of six 7-year old children in Mrs. Jones' second grade class (25, 60, 51, 47, 49, 45). Find the mean, median, mode, variance, and standard deviation. 2. If the variance is 846, what is the standard deviation? 3. If we have the following...
grademaster
Other
MATH 534 Week 7 Course Project Part C: Regression and Correlation Analysis.
MATH 534 Week 7 Course Project Part C: Regression and Correlation Analysis.
 Smartsolutions