
SOC 200 Case Study Report 1: THREE JAYS CORPORATION; Complete solution. (SOC200)
The University of Arizona
Here are the best resources to pass SOC 200 Case Study Report 1: THREE JAYS CORPORATION; Complete solution. (SOC200). Find SOC 200 Case Study Report 1: THREE JAYS CORPORATION; Complete solution. (SOC200) study guides, notes, assignments, and much more.
Other
Soc 200 - Case Study Report 1: Three Jays Corporation Solution Provided
Soc 200 - Case Study Report 1: Three Jays Corporation Solution Provided
 Proreader
Exam (elaborations)
SOC 200 - Case Study Report 1: THREE JAYS CORPORATION; Complete Solution.
PopularSOC 200 - Case Study Report 1: THREE JAYS CORPORATION; Complete Solution. Using the data in case Exhibit 4 and the 2012 annual demand, calculate the EOQ and ROP quantities for the five SKUs scheduled to be produced in the last week of June. How do these amounts compare with those calculated in 2011? Compare the increases in EOQs with the increases in annual demand. (2.5 points)
 ExcelAcademia2026
Exam (elaborations)
SOC 200 - Case Study Report 1: THREE JAYS CORPORATION; Complete solution.
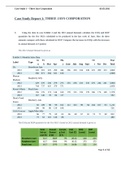
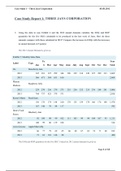
Case Study Report 1: THREE JAYS CORPORATION 1. Using the data in case Exhibit 4 and the 2012 annual demand, calculate the EOQ and ROP quantities for the five SKUs scheduled to be produced in the last week of June. How do these amounts compare with those calculated in 2011? Compare the increases in EOQs with the increases in annual demand. (2.5 points) The 2012 Annual Demand is given as The EOQ and ROP quantities for the five SKU’s based on 2012 annual demand is given as As Demand increased fro...
 Proven