MATH 302
Latest uploads at MATH 302. Looking for notes at MATH 302? We have lots of notes, study guides and study notes available for your school.
-
145
- 0
-
22
All courses for MATH 302
-
MATH 302 145
-
MATH 302| 2
Latest content MATH 302
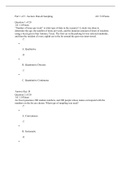
AMERICAN PUBLIC UNIVERSITY MATH 302 QUIZ 1 Part 2 of 3 - 4.0/ 6.0 Points Question 13 of 20 0.0/ 1.0 Points Click to see additional instructions A sample of 150 students at a State University was taken after the final business statistics exam to ask them whether they went partying the weekend before the final or spent the weekend studying, and whether they did well or poorly on the final. The following table contains the result. Did Well on Exam Did Poorly on Exam Studying ...
- Exam (elaborations)
- • 15 pages's •
-
MATH 302•MATH 302
Preview 2 out of 15 pages
Getting your document ready...
AMERICAN PUBLIC UNIVERSITY MATH 302 QUIZ 1 Part 2 of 3 - 4.0/ 6.0 Points Question 13 of 20 0.0/ 1.0 Points Click to see additional instructions A sample of 150 students at a State University was taken after the final business statistics exam to ask them whether they went partying the weekend before the final or spent the weekend studying, and whether they did well or poorly on the final. The following table contains the result. Did Well on Exam Did Poorly on Exam Studying ...
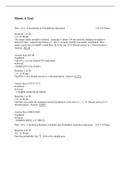
Part 1 of 6 - Calculations of Probabilities Questions 3.0/ 3.0 Points Question 1 of 20 1.0/ 1.0 Points The mean yearly rainfall in Sydney, Australia, is about 134 mm and the standard deviation is about 66 mm ("Annual maximums of," 2013). Assume rainfall is normally distributed. How many yearly mm of rainfall would there be in the top 15%? Round answer to 2 decimal places. Answer: 202.40 Answer Key:202.40 Feedback: Top 15%, is in the bottom 85% percentile. In Excel, =NORM.INV(...
- Exam (elaborations)
- • 10 pages's •
-
MATH 302•MATH 302
Preview 2 out of 10 pages
Getting your document ready...
Part 1 of 6 - Calculations of Probabilities Questions 3.0/ 3.0 Points Question 1 of 20 1.0/ 1.0 Points The mean yearly rainfall in Sydney, Australia, is about 134 mm and the standard deviation is about 66 mm ("Annual maximums of," 2013). Assume rainfall is normally distributed. How many yearly mm of rainfall would there be in the top 15%? Round answer to 2 decimal places. Answer: 202.40 Answer Key:202.40 Feedback: Top 15%, is in the bottom 85% percentile. In Excel, =NORM.INV(...