TASK 1
You should spend about 20 minutes on this task.
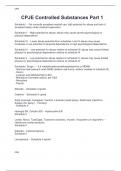
The chart below gives information about Southland's main exports in 2000, 2014,
and future projections for 2025.
Summarise the information by selecting and reporting the main features, and
make comparisons where relevant.
Write at least 150 words.
The bar chart given illustrates information about Southland's main exports -International tourism, dairy
products, and meat products in 2000, 2014, and projected values for 2025.
Overall, all three categories follow distinct patterns. Tourism shows steady growth across the period, dairy
rises sharply before falling slightly, and meat declines throughout.
In 2000, the exports of international tourism were over £8 billion. In 2014, this figure steadily increased
to nearly £9 billion, while it is projected to reach over £9 billion in 2025. Dairy products had exports of
about £7 billion in 2000. Additionally, the figure rose to about £10 billion in 2014 and is expected to be
above £9 billion in 2025. For meat products, the exports were £6 billion in 2000, decreased to under £6
billion in 2014, and are projected to be £5 billion in 2025.
Comparing the three categories, tourism was the highest earner in 2000, dairy took the lead by 2014, and
both are expected to remain strong in 2025. Meat, however, is projected to follow a continued downward
path.
You should spend about 20 minutes on this task.
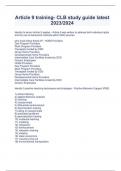
The chart below gives information about Southland's main exports in 2000, 2014,
and future projections for 2025.
Summarise the information by selecting and reporting the main features, and
make comparisons where relevant.
Write at least 150 words.
The bar chart given illustrates information about Southland's main exports -International tourism, dairy
products, and meat products in 2000, 2014, and projected values for 2025.
Overall, all three categories follow distinct patterns. Tourism shows steady growth across the period, dairy
rises sharply before falling slightly, and meat declines throughout.
In 2000, the exports of international tourism were over £8 billion. In 2014, this figure steadily increased
to nearly £9 billion, while it is projected to reach over £9 billion in 2025. Dairy products had exports of
about £7 billion in 2000. Additionally, the figure rose to about £10 billion in 2014 and is expected to be
above £9 billion in 2025. For meat products, the exports were £6 billion in 2000, decreased to under £6
billion in 2014, and are projected to be £5 billion in 2025.
Comparing the three categories, tourism was the highest earner in 2000, dairy took the lead by 2014, and
both are expected to remain strong in 2025. Meat, however, is projected to follow a continued downward
path.