D366 Complete Guide and breakdown.
Financial Analysis Structure:
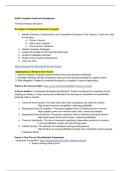
Six Steps in Financial Statement Analysis
1. Identify Economic Characteristics and Competitive Dynamics in the Industry- 3 tools are used
for this step
a. Porters 5 forces
b. Value chain Analysis
c. The economic Attributes
2. Identify Company Strategies
3. Assess the Quality of the Financial Statements
4. Analyze Profitability and Risk
5. Project Future Financial Statements
6. Value the Firm
https://youtu.be/T3T8d5XvACk?feature=shared
Applications of Porter’s Five Forces
1. Industry Analysis: Evaluate market attractiveness and potential profitability.
2. Strategic Planning: Identify competitive pressures and develop strategies to address them.
3. Risk Mitigation: Prepare for potential disruptions in supplier or buyer relationships.
Porter’s five forces model: https://youtu.be/ehSQR6oMBHA?feature=shared
5 forces model is a framework developed by Michael E. Porter to analyze the competitive forces
shaping an industry. It helps businesses understand the intensity of competition and profitability
potential within a specific.
1. Threat of New Entrants: The ease with which new competitors can enter the market.
- High threat increases competition, reducing profitability
2. Bargaining Power of Suppliers: The power suppliers have to influence prices or terms.
- High supplier power can increase input costs, squeezing margins.
3. Bargaining Power of Buyers: The power customers have to influence pricing and terms.
- High buyer power forces prices down, reducing profitability.
4. Threat of Substitutes: The risk of customers switching to alternative products or services.
- A strong substitute market can limit pricing power.
5. Industry Rivalry: The intensity of competition among existing players.
- High Rivalry can erode profitability through price competition and increased
marketing efforts.
Porter’s Five Forces Classification Framework:
-Horizontal Competition: https://youtu.be/5YggeZav8Uc?feature=shared
1. Rivalry among existing firms
, 2. Threat of New Entrants
3. Threat of substitutes
- Vertical Competition:
4. Buyer Power
5. Supplier Power
Value Chain Analysis: the sequence or chain of activities involved in the creation, manufacture, and
distribution of its products and services. You can determine where value is added within an industry.
You can also use the value chain to identify the strategic positioning of a particular firm within the
industry. EX: Coffee Industry Value Chain
Economic Attributes Framework:
1. Demand
2. Supply
3. Manufacturing
4. Marketing
5. Investing and Financing
Vertical Analysis: https://youtu.be/Z5de53Fxd58?feature=shared
- Common-size income statement
- Common-size balance sheet
Vertical analysis is when you analyze the same company from previous years or terms.
% Change Analysis (Percentage Change Analysis) is a method used to measure the
relative change in a value over time, expressed as a percentage. It is widely applied in
various fields, including business, finance, marketing, and economics, to understand trends,
evaluate performance, and make data-driven decisions.
Formula
Percentage Change = New Value-Old Value / Old Value (x 100)
1. New Value: The updated or current value being analyzed.
2. Old Value: The initial or previous value being compared to.
3. Result: A positive result indicates a percentage increase, while a negative result
signifies a percentage decrease.
, Horizontal Analysis- https://youtu.be/cPfWXsrfkM4?feature=shared
- Trend Statements
- % change statements
Horizontal Analysis is when you analyze companies in the same industry. For example, if you were to
compare Lowe's to Home Depot.
There are seven steps in a forecasting plan:
1. Project revenues from selling products and delivering services to customers.
2. Project operating expenses and derive projected operating income.
3. Project the operating assets that will be necessary to support the level of operations projected
in the previous two steps.
4. Project the financial liabilities, financial assets, and common equity capital that will be
necessary to finance the operating assets.
5. Project nonrecurring gains or losses and derive projected pretax income.
6. At this point, the balance sheet will not balance, so there will have to be a determination made
on how the organization can use its financial flexibility to balance the sheet.
7. Derive the projected statement of cash flows from the projected income statement
Market Share Analysis: Tracking your company’s market share changes compared to
competitors. = Market share Y2 - Market share Y1 / Market share Y1 X 100
EX: Market Share in 2024: 18% Market Share in 2025: 20%
Percentage Change 20 – x 100 = 11.1%
An 11.1% increase in market share highlights competitive gains
A Framework for Strategic Analysis is a structured approach to assessing an organization’s
internal and external environment, identifying key opportunities and challenges, and aligning
resources to achieve long-term goals. It serves as a roadmap for decision-making and strategy
formulation.
Product Differentiation Strategy is a business strategy where a company offers a product or
service that is distinct from competitors in a way that is valuable to customers. The goal is to make
the product unique in terms of quality, features, design, customer experience, or other attributes,
creating a competitive advantage and allowing the company to charge a premium price.
Industry Diversification Strategy is a business strategy where a company expands its operations
by entering new industries that are different from its core business activities. This strategy involves
spreading business risks and opportunities across different sectors, rather than focusing on a single
industry.
Low-Cost Leadership Strategy is a business strategy where a company focuses on becoming the
lowest-cost producer in its industry or market. The primary goal is to gain a competitive advantage by
offering products or services at a lower price than competitors, often by minimizing production or
Financial Analysis Structure:
Six Steps in Financial Statement Analysis
1. Identify Economic Characteristics and Competitive Dynamics in the Industry- 3 tools are used
for this step
a. Porters 5 forces
b. Value chain Analysis
c. The economic Attributes
2. Identify Company Strategies
3. Assess the Quality of the Financial Statements
4. Analyze Profitability and Risk
5. Project Future Financial Statements
6. Value the Firm
https://youtu.be/T3T8d5XvACk?feature=shared
Applications of Porter’s Five Forces
1. Industry Analysis: Evaluate market attractiveness and potential profitability.
2. Strategic Planning: Identify competitive pressures and develop strategies to address them.
3. Risk Mitigation: Prepare for potential disruptions in supplier or buyer relationships.
Porter’s five forces model: https://youtu.be/ehSQR6oMBHA?feature=shared
5 forces model is a framework developed by Michael E. Porter to analyze the competitive forces
shaping an industry. It helps businesses understand the intensity of competition and profitability
potential within a specific.
1. Threat of New Entrants: The ease with which new competitors can enter the market.
- High threat increases competition, reducing profitability
2. Bargaining Power of Suppliers: The power suppliers have to influence prices or terms.
- High supplier power can increase input costs, squeezing margins.
3. Bargaining Power of Buyers: The power customers have to influence pricing and terms.
- High buyer power forces prices down, reducing profitability.
4. Threat of Substitutes: The risk of customers switching to alternative products or services.
- A strong substitute market can limit pricing power.
5. Industry Rivalry: The intensity of competition among existing players.
- High Rivalry can erode profitability through price competition and increased
marketing efforts.
Porter’s Five Forces Classification Framework:
-Horizontal Competition: https://youtu.be/5YggeZav8Uc?feature=shared
1. Rivalry among existing firms
, 2. Threat of New Entrants
3. Threat of substitutes
- Vertical Competition:
4. Buyer Power
5. Supplier Power
Value Chain Analysis: the sequence or chain of activities involved in the creation, manufacture, and
distribution of its products and services. You can determine where value is added within an industry.
You can also use the value chain to identify the strategic positioning of a particular firm within the
industry. EX: Coffee Industry Value Chain
Economic Attributes Framework:
1. Demand
2. Supply
3. Manufacturing
4. Marketing
5. Investing and Financing
Vertical Analysis: https://youtu.be/Z5de53Fxd58?feature=shared
- Common-size income statement
- Common-size balance sheet
Vertical analysis is when you analyze the same company from previous years or terms.
% Change Analysis (Percentage Change Analysis) is a method used to measure the
relative change in a value over time, expressed as a percentage. It is widely applied in
various fields, including business, finance, marketing, and economics, to understand trends,
evaluate performance, and make data-driven decisions.
Formula
Percentage Change = New Value-Old Value / Old Value (x 100)
1. New Value: The updated or current value being analyzed.
2. Old Value: The initial or previous value being compared to.
3. Result: A positive result indicates a percentage increase, while a negative result
signifies a percentage decrease.
, Horizontal Analysis- https://youtu.be/cPfWXsrfkM4?feature=shared
- Trend Statements
- % change statements
Horizontal Analysis is when you analyze companies in the same industry. For example, if you were to
compare Lowe's to Home Depot.
There are seven steps in a forecasting plan:
1. Project revenues from selling products and delivering services to customers.
2. Project operating expenses and derive projected operating income.
3. Project the operating assets that will be necessary to support the level of operations projected
in the previous two steps.
4. Project the financial liabilities, financial assets, and common equity capital that will be
necessary to finance the operating assets.
5. Project nonrecurring gains or losses and derive projected pretax income.
6. At this point, the balance sheet will not balance, so there will have to be a determination made
on how the organization can use its financial flexibility to balance the sheet.
7. Derive the projected statement of cash flows from the projected income statement
Market Share Analysis: Tracking your company’s market share changes compared to
competitors. = Market share Y2 - Market share Y1 / Market share Y1 X 100
EX: Market Share in 2024: 18% Market Share in 2025: 20%
Percentage Change 20 – x 100 = 11.1%
An 11.1% increase in market share highlights competitive gains
A Framework for Strategic Analysis is a structured approach to assessing an organization’s
internal and external environment, identifying key opportunities and challenges, and aligning
resources to achieve long-term goals. It serves as a roadmap for decision-making and strategy
formulation.
Product Differentiation Strategy is a business strategy where a company offers a product or
service that is distinct from competitors in a way that is valuable to customers. The goal is to make
the product unique in terms of quality, features, design, customer experience, or other attributes,
creating a competitive advantage and allowing the company to charge a premium price.
Industry Diversification Strategy is a business strategy where a company expands its operations
by entering new industries that are different from its core business activities. This strategy involves
spreading business risks and opportunities across different sectors, rather than focusing on a single
industry.
Low-Cost Leadership Strategy is a business strategy where a company focuses on becoming the
lowest-cost producer in its industry or market. The primary goal is to gain a competitive advantage by
offering products or services at a lower price than competitors, often by minimizing production or

