Exam (elaborations)
MATH 1280 Self-Quiz Unit 3 |MATH1280 Self-Quiz Module 3 (100%) – University of the People
Rating
Sold
-
Pages
11
Grade
A
Uploaded on
22-02-2021
Written in
2020/2021
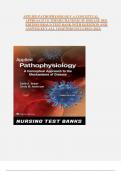
MATH 1280 Self-Quiz Unit 3 (100%) – University of the People Grade 10.00 out of 10.00 (100%) Question 1 Correct Question text In Figure A you will find box plots for three sets of data. In Figure B are the histograms for the same sets of data, but in a different order. Associate each box plot with its relative histogram. Figure A: Figure B:
Show more
Read less
Institution
Other
Course
Math 1280 (MATH1280)
Whoops! We can’t load your doc right now. Try again or contact support.
Written for
- Institution
-
Other
- Course
-
Math 1280 (MATH1280)
Document information
- Uploaded on
- February 22, 2021
- Number of pages
- 11
- Written in
- 2020/2021
- Type
- Exam (elaborations)
- Contains
- Questions & answers
Subjects
- using the data
- determine which one
-
math 1280 self quiz unit 3 100 – university of the people
-
the distribution is skewed to the left true or false
-
and without computing the mean and the median
$13.99
Get access to the full document:
100% satisfaction guarantee
Immediately available after payment
Both online and in PDF
No strings attached