Lecture 5 Analyse phase
Analyse phase
- Identify and describe causes
- Quantify and verify causes
- Quantify “opportunity”
Identify and describe causes
ID & formulate causes
- Map sub-processes
- Stratification
- Cause effect diagrams
- Measurements
- ‘scatter diagrams’
Focus on the process input variable (x’s), process variables (x’s) and output variables (y’s)
Reaction Predictor
- Y - X1, X2, …, Xn
- Dependent - Independent
- Output - Input & process
- Effect - Cause
- Symptom - Problem
- Monitor - Check
Identify the vital few
- What essential input and process variables (x’s) determine the CTQ output (y)?
- Develop and implement solutions that strive after improvements on these essential parts
- Implement a monitoring strategy for the solution
- Y = f(x1, x2, …, xn)
Quantify and verify causes
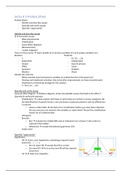
Cause & effect diagram fishbone diagram, shows all probable causes that lead to the effect Y
Quantify & verify with statistics
- Stratification a data analysis technique in which data are sorted in various categories. By
the identification of specific factors, one can discern suspicious patterns and see differences
in process
o How to collect data: ID the factors for stratification before you start data collection.
Are you sure you can measure the variables or name them? Record the stratification
factors for all collected data
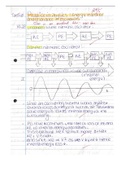
- Histogram
- Box plot
o Box includes the middle 50% and an indication line is drawn in the centre to
represent the median
o Whisker(s) include the bottom/uppermost 25%
- Scatter plot
Quantify “opportunity”
Hypotheses
- H0 H zero, your hypothesis, everything is equal to each
other (H0: .. = .. = ..)
o Do not reject H0 accept that H0 is correct
o Do reject H0 Ha is correct and H0 will be rejected
(incorrect)
- Ha At least one inequality,
Analyse phase
- Identify and describe causes
- Quantify and verify causes
- Quantify “opportunity”
Identify and describe causes
ID & formulate causes
- Map sub-processes
- Stratification
- Cause effect diagrams
- Measurements
- ‘scatter diagrams’
Focus on the process input variable (x’s), process variables (x’s) and output variables (y’s)
Reaction Predictor
- Y - X1, X2, …, Xn
- Dependent - Independent
- Output - Input & process
- Effect - Cause
- Symptom - Problem
- Monitor - Check
Identify the vital few
- What essential input and process variables (x’s) determine the CTQ output (y)?
- Develop and implement solutions that strive after improvements on these essential parts
- Implement a monitoring strategy for the solution
- Y = f(x1, x2, …, xn)
Quantify and verify causes
Cause & effect diagram fishbone diagram, shows all probable causes that lead to the effect Y
Quantify & verify with statistics
- Stratification a data analysis technique in which data are sorted in various categories. By
the identification of specific factors, one can discern suspicious patterns and see differences
in process
o How to collect data: ID the factors for stratification before you start data collection.
Are you sure you can measure the variables or name them? Record the stratification
factors for all collected data
- Histogram
- Box plot
o Box includes the middle 50% and an indication line is drawn in the centre to
represent the median
o Whisker(s) include the bottom/uppermost 25%
- Scatter plot
Quantify “opportunity”
Hypotheses
- H0 H zero, your hypothesis, everything is equal to each
other (H0: .. = .. = ..)
o Do not reject H0 accept that H0 is correct
o Do reject H0 Ha is correct and H0 will be rejected
(incorrect)
- Ha At least one inequality,