,
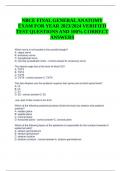
,QUICK GUIDE TO URINALYSIS FIGURES BLOOD CELLS
Cell Type Figures Image Gallery #
CASTS Red blood cells 7.13, 7.14, 7.15, (7.16, 7.24, 3, 9, 10, 13, 69,
7.27, 7.28A, 7.33, 7.47, 7.61) 73, 76, 82, (86,
Image
87, 89)
Type Figures Gallery #
Dysmorphic RBCs 7.14, 7.15, Table 7.5
Broad 7.37 31
White blood cells 7.6, 7.9, 7.13, 7.16, 7.17, 7.18, 1, 5, 11, 12, 13,
Hyaline 7.35, 7.36, 7.38, 7.42, 7.43, 33-35 (38) 7.19, 7.20, 7.22, 7.23, (7.24, (66)
7.51, 7.59, (7.72, 7.117), 7.26), 7.61, (7.62, 7.63), 7.64
(18.12)
Macrophages 7.23
Granular 7.37, 7.39, 7.45, 7.48, 27-32
7.51, 7.52, 7.57
Cellular:
EPITHELIAL CELLS
RBC 7.46, 7.47 (21), 22-24
Cell Type Figures Image Gallery #
WBC 7.49 20, 21
Renal epithelial cell 7.50, 7.58 16-18, (19, 26) Squamous 7.4, 7.10, (7.16), 7.25, 7.26, 7.27, 7.67, 7.68 (11), 65-67
Mixed cell 7.41 15, 21, 22 Clue cells 7.67, 13.4 65
Waxy 7.12, 7.37, 7.39, 7.40, 36-40 Transitional 7.28, 7.29 67-71
7.44, 7.45, 7.59, 18.21 Renal 7.5, 7.21, 7.31, 7.32, 7.33 71-73, 77
Fatty 7.53, 7.54 19, 25, 26, Decoy cells 7.30
74,75, 79
Crystalline 7.55, 7.56
Figure numbers in parentheses indicate that the element is present but it is FAT
not the predominant element in the image.
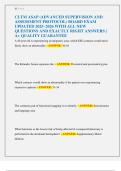
Element Figures Image Gallery #
Free fat globules 7.11 (74-75, 79)
Fatty casts—
CRYSTALS – ALSO SEE TABLE 7.14 See Casts
Image Oval fat bodies 7.7, 7.24, 7.34, 7.74, 7.75, (7.105A) 26, 75-80
pH* Crystal Figures Gallery #
<5.7 Uric acid 7.78A, 7.80, (51), 61-64
7.81, 7.82, 7.83, MICROORGANISMS (ALPHABETICAL
7.84, 7.85 ORDER)
<5.8 2,8-Dihydroxyadenine 7.104
Organism Figures Image Gallery #
≤7 Urates, amorphous 7.78
Urate, monosodium 7.79 60 Bacteria 7.8, 7.61 68, 81-82, (86, 94)
Bilirubin 7.100 43 Giardia lamblia 7.70
Cholesterol 7.105, 7.106, 7.107 48 Pinworm eggs 7.69
Leucine 7.103 Schistosoma haematobium 7.71
Tyrosine 7.102 Trichomonads 7.65, 7.66, 13.7 83-85
Ionic radiographic media 7.108 Yeast and/or pseudohyphae (7.13, 7.16, 7.17), 50, 86-89
7.62, 7.63, 7.64
Ampicillin (medication) 7.110
Sulfa drugs (medication) 7.112, 7.113 50-51
5-8 Calcium oxalate (7.56), 7.86, 7.87, 45-47
7.88, 7.89, 7.90, MISCELLANEOUS ELEMENTS
7.91, 7.92 Element Figures Image Gallery #
Cystine 7.101 49
Air bubbles Table 7.15 1-2
(6)-8 Phosphate, calcium 7.95, 7.96, 7.97 56-59
Fibers 7.60, 7.116, 7.117, Table 7.15, 7-8
Acyclovir (medication) 7.109 18.12
Indinavir sulfate (medication) 7.111 52 Fungal spores Table 7.15
≥7 Phosphate, amorphous 7.93 Glass fragments --- 5
Phosphate, triple 7.94 53-55 Hemosiderin 7.76 90-91
Carbonate, calcium (7.96), 7.99 44 Mucus (7.25, 7.35, 7.36, 7.38, 7.42), 92
Ammonium biurate (7.96), 7.98 41-42 7.72, (18.12)
Plastic fragments --- 3-4
*Approximate pH value or range.
Pollen grains 7.116, Table 7.1
Sperm 7.77 (79), 93-94
Starch 7.114, 7.115 4
Talc 7.116 6
, Fundamentals of
Urine &
Body Fluid
Analysis
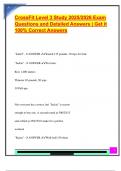
,QUICK GUIDE TO URINALYSIS FIGURES BLOOD CELLS
Cell Type Figures Image Gallery #
CASTS Red blood cells 7.13, 7.14, 7.15, (7.16, 7.24, 3, 9, 10, 13, 69,
7.27, 7.28A, 7.33, 7.47, 7.61) 73, 76, 82, (86,
Image
87, 89)
Type Figures Gallery #
Dysmorphic RBCs 7.14, 7.15, Table 7.5
Broad 7.37 31
White blood cells 7.6, 7.9, 7.13, 7.16, 7.17, 7.18, 1, 5, 11, 12, 13,
Hyaline 7.35, 7.36, 7.38, 7.42, 7.43, 33-35 (38) 7.19, 7.20, 7.22, 7.23, (7.24, (66)
7.51, 7.59, (7.72, 7.117), 7.26), 7.61, (7.62, 7.63), 7.64
(18.12)
Macrophages 7.23
Granular 7.37, 7.39, 7.45, 7.48, 27-32
7.51, 7.52, 7.57
Cellular:
EPITHELIAL CELLS
RBC 7.46, 7.47 (21), 22-24
Cell Type Figures Image Gallery #
WBC 7.49 20, 21
Renal epithelial cell 7.50, 7.58 16-18, (19, 26) Squamous 7.4, 7.10, (7.16), 7.25, 7.26, 7.27, 7.67, 7.68 (11), 65-67
Mixed cell 7.41 15, 21, 22 Clue cells 7.67, 13.4 65
Waxy 7.12, 7.37, 7.39, 7.40, 36-40 Transitional 7.28, 7.29 67-71
7.44, 7.45, 7.59, 18.21 Renal 7.5, 7.21, 7.31, 7.32, 7.33 71-73, 77
Fatty 7.53, 7.54 19, 25, 26, Decoy cells 7.30
74,75, 79
Crystalline 7.55, 7.56
Figure numbers in parentheses indicate that the element is present but it is FAT
not the predominant element in the image.
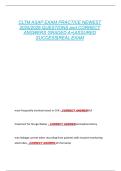
Element Figures Image Gallery #
Free fat globules 7.11 (74-75, 79)
Fatty casts—
CRYSTALS – ALSO SEE TABLE 7.14 See Casts
Image Oval fat bodies 7.7, 7.24, 7.34, 7.74, 7.75, (7.105A) 26, 75-80
pH* Crystal Figures Gallery #
<5.7 Uric acid 7.78A, 7.80, (51), 61-64
7.81, 7.82, 7.83, MICROORGANISMS (ALPHABETICAL
7.84, 7.85 ORDER)
<5.8 2,8-Dihydroxyadenine 7.104
Organism Figures Image Gallery #
≤7 Urates, amorphous 7.78
Urate, monosodium 7.79 60 Bacteria 7.8, 7.61 68, 81-82, (86, 94)
Bilirubin 7.100 43 Giardia lamblia 7.70
Cholesterol 7.105, 7.106, 7.107 48 Pinworm eggs 7.69
Leucine 7.103 Schistosoma haematobium 7.71
Tyrosine 7.102 Trichomonads 7.65, 7.66, 13.7 83-85
Ionic radiographic media 7.108 Yeast and/or pseudohyphae (7.13, 7.16, 7.17), 50, 86-89
7.62, 7.63, 7.64
Ampicillin (medication) 7.110
Sulfa drugs (medication) 7.112, 7.113 50-51
5-8 Calcium oxalate (7.56), 7.86, 7.87, 45-47
7.88, 7.89, 7.90, MISCELLANEOUS ELEMENTS
7.91, 7.92 Element Figures Image Gallery #
Cystine 7.101 49
Air bubbles Table 7.15 1-2
(6)-8 Phosphate, calcium 7.95, 7.96, 7.97 56-59
Fibers 7.60, 7.116, 7.117, Table 7.15, 7-8
Acyclovir (medication) 7.109 18.12
Indinavir sulfate (medication) 7.111 52 Fungal spores Table 7.15
≥7 Phosphate, amorphous 7.93 Glass fragments --- 5
Phosphate, triple 7.94 53-55 Hemosiderin 7.76 90-91
Carbonate, calcium (7.96), 7.99 44 Mucus (7.25, 7.35, 7.36, 7.38, 7.42), 92
Ammonium biurate (7.96), 7.98 41-42 7.72, (18.12)
Plastic fragments --- 3-4
*Approximate pH value or range.
Pollen grains 7.116, Table 7.1
Sperm 7.77 (79), 93-94
Starch 7.114, 7.115 4
Talc 7.116 6
, Fundamentals of
Urine &
Body Fluid
Analysis