RESEARCH METHODS IN FINANCE
1. INTRODUCTION AND DEALING WITH DATA .................................................................................................................. 3
2. CLASSICAL LINEAR REGRESSION MODEL (CLRM): OVERVIEW .................................................................................... 18
3. CLASSICAL LINEAR REGRESSION MODEL (CLRM): HYPOTHESIS TESTING ................................................................... 32
4. CLRM ASSUMPTIONS - DIAGNOSTIC TESTS 1 .............................................................................................................. 48
5. CLRM ASSUMPTIONS - DIAGNOSTIC TESTS 2 .............................................................................................................. 60
6. CLRM ASSUMPTIONS - DIAGNOSTIC TESTS 3 .............................................................................................................. 75
7. Limited Dependent Variable Models .......................................................................................................................... 86
8. Time Series: Non-Stationarity and Spurious Regression ............................................................................................. 97
9. Granger Causality and VAR ....................................................................................................................................... 110
10. Panel Data............................................................................................................................................................. 122
11. Event Study Analysis ............................................................................................................................................. 138
,2
,1. INTRODUCTION AND DEALING WITH DATA
Introduction
Purpose of Research Methods or Econometrics
Research Methods in Finance = Financial Econometrics
What is Econometrics?
- Measurement in economics
- Financial econometrics: The application of statistical techniques to problems in finance
- Financial Econometrics ≠ Economic Econometrics
o Difference is in the data that is available
§ There’s much less data available about economics than about finance
• E.g. GDP data is available 4 times per year à economic data
• E.g. Stock prices (currencies, bonds, …) are available every trading day à financial data
§ Financial data differs from macroeconomic data in terms of their frequency, accuracy,
seasonality and other properties
o Financial data less exposed to
§ Small samples problem
• Occurs in economics because of lack of data at hand
§ Measurement error
• Estimation leads to possible measurement errors (e.g. measurement of GDP)
§ Data revisions
• E.g. Data about GDP is updated when new information is available
- Disadvantage of financial data
o Financial data can be noisy
§ Difficult to separate trends/patterns from random and uninteresting features
§ Cause: people trade in an irrational way
§ E.g. Stock prices go up and down all the time
o Financial data are almost always not normally distributed even though most techniques in econometrics
assume that they are
- Challenge: separate what is noise from what is fundamental
o E.g. stock prices: Fluctuations around the trend are noise, the trend itself is fundamental
Financial application of statistical tools
- Market microstructure problems
o Market microstructure = process whereby investor’s preferences and desires are translated into
financial market transactions
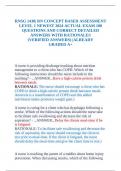
General Framework
- Process of how research is conducted
- Start from a theory
- Make an estimable theoretical model that estimates the dependent
variable by using the independent variable
o E.g. regression model
- Collect data
- Model estimation
- Statistically adequate model
o Interpret model and use for analysis: Check if beta equals the
estimated value
o If not, reformulate model à Process of building a robust empirical model = iterative
3
, Functions
Function
- A mapping or relationship between an input or set of inputs and an output
- Domain of x: set of values that x can take
- Range: set of values that y can take
Y (the output) is a function f (x) of x (the input)
- y = f (x)
- y could be a linear function of x where the relationship can be expressed on a straight line
o relationship: y = a + bx
o y and x: variables
o a and b: parameters
o a: intercept
o b: slope or gradient
- Y could be non-linear where it would be expressed graphically as a curve
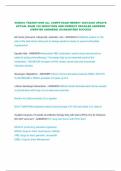
Straight lines
Example: Suppose that we’re modelling the relationship between a student’s average mark, y (in %), and the number of
hours studied per year, x
Suppose that the relationship can be written as a linear function:
y = 25 + 0.05x (example book page 45-46)
- Y: vertical axis
- X: horizontal axis
- Intercept: 25
- Slope: 0.05
- Root: x where y = 0
Estimations
- If you do not study, your final score will be 25%
o 25% = 25 + 0.05 x 0
- If you study 1000 hours, your final score will be 75%
o 75% = 25 + 0.05 x 1000
Change in variables: D
- Dy = bDx
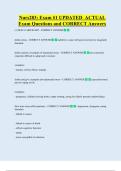
Other relationships
- The relationship can be non-linear: Convex/concave
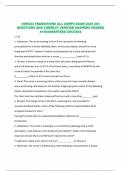
Polynomial functions
- Higher order powers of the variable x are added into the function
- E.g.
- The higher the order of the polynomial, the more complex the relationship between y and x
Quadratic function
-
- È- or Ç- shaped
4
1. INTRODUCTION AND DEALING WITH DATA .................................................................................................................. 3
2. CLASSICAL LINEAR REGRESSION MODEL (CLRM): OVERVIEW .................................................................................... 18
3. CLASSICAL LINEAR REGRESSION MODEL (CLRM): HYPOTHESIS TESTING ................................................................... 32
4. CLRM ASSUMPTIONS - DIAGNOSTIC TESTS 1 .............................................................................................................. 48
5. CLRM ASSUMPTIONS - DIAGNOSTIC TESTS 2 .............................................................................................................. 60
6. CLRM ASSUMPTIONS - DIAGNOSTIC TESTS 3 .............................................................................................................. 75
7. Limited Dependent Variable Models .......................................................................................................................... 86
8. Time Series: Non-Stationarity and Spurious Regression ............................................................................................. 97
9. Granger Causality and VAR ....................................................................................................................................... 110
10. Panel Data............................................................................................................................................................. 122
11. Event Study Analysis ............................................................................................................................................. 138
,2
,1. INTRODUCTION AND DEALING WITH DATA
Introduction
Purpose of Research Methods or Econometrics
Research Methods in Finance = Financial Econometrics
What is Econometrics?
- Measurement in economics
- Financial econometrics: The application of statistical techniques to problems in finance
- Financial Econometrics ≠ Economic Econometrics
o Difference is in the data that is available
§ There’s much less data available about economics than about finance
• E.g. GDP data is available 4 times per year à economic data
• E.g. Stock prices (currencies, bonds, …) are available every trading day à financial data
§ Financial data differs from macroeconomic data in terms of their frequency, accuracy,
seasonality and other properties
o Financial data less exposed to
§ Small samples problem
• Occurs in economics because of lack of data at hand
§ Measurement error
• Estimation leads to possible measurement errors (e.g. measurement of GDP)
§ Data revisions
• E.g. Data about GDP is updated when new information is available
- Disadvantage of financial data
o Financial data can be noisy
§ Difficult to separate trends/patterns from random and uninteresting features
§ Cause: people trade in an irrational way
§ E.g. Stock prices go up and down all the time
o Financial data are almost always not normally distributed even though most techniques in econometrics
assume that they are
- Challenge: separate what is noise from what is fundamental
o E.g. stock prices: Fluctuations around the trend are noise, the trend itself is fundamental
Financial application of statistical tools
- Market microstructure problems
o Market microstructure = process whereby investor’s preferences and desires are translated into
financial market transactions
General Framework
- Process of how research is conducted
- Start from a theory
- Make an estimable theoretical model that estimates the dependent
variable by using the independent variable
o E.g. regression model
- Collect data
- Model estimation
- Statistically adequate model
o Interpret model and use for analysis: Check if beta equals the
estimated value
o If not, reformulate model à Process of building a robust empirical model = iterative
3
, Functions
Function
- A mapping or relationship between an input or set of inputs and an output
- Domain of x: set of values that x can take
- Range: set of values that y can take
Y (the output) is a function f (x) of x (the input)
- y = f (x)
- y could be a linear function of x where the relationship can be expressed on a straight line
o relationship: y = a + bx
o y and x: variables
o a and b: parameters
o a: intercept
o b: slope or gradient
- Y could be non-linear where it would be expressed graphically as a curve
Straight lines
Example: Suppose that we’re modelling the relationship between a student’s average mark, y (in %), and the number of
hours studied per year, x
Suppose that the relationship can be written as a linear function:
y = 25 + 0.05x (example book page 45-46)
- Y: vertical axis
- X: horizontal axis
- Intercept: 25
- Slope: 0.05
- Root: x where y = 0
Estimations
- If you do not study, your final score will be 25%
o 25% = 25 + 0.05 x 0
- If you study 1000 hours, your final score will be 75%
o 75% = 25 + 0.05 x 1000
Change in variables: D
- Dy = bDx
Other relationships
- The relationship can be non-linear: Convex/concave
Polynomial functions
- Higher order powers of the variable x are added into the function
- E.g.
- The higher the order of the polynomial, the more complex the relationship between y and x
Quadratic function
-
- È- or Ç- shaped
4