C207 WGU – DATA-DRIVEN DECISION MAKING
EXAM: IN-DEPTH EXPLORATION OF DATA
ACQUISITION, INTERPRETATION, STATISTICAL
REASONING, AND APPLICATION FOR
ORGANIZATIONAL SUCCESS
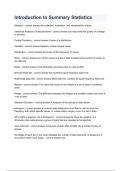
There are two types of statistics (Analytics)
1. Descriptive
2. Inferential
Descriptive statistics are used to _________
Inform; Explain
Inferential statistics are used to ______
Predict/Show trend
Name the 4 levels of measurement
1. NOIR (Nominal)
2. Ordinal
3. Interval
Ratio
Continuous data with unique zero point (Level of Measurement)
Ratio
Orders data at EQUAL distance apart (Level of Measurement)
Interval
Place quantitative objects in some kind of order (Level of Measurement)
Ordinal
,Identify, Group, or Categorize (Level of Measurement)
Nominal
Outliers create this type of error
Out-of-Range
Unpredictable error/No correlation
Random Error
Error may occur from missing data. (EX: Space not filled in); Distorted results
Omission Error
This error repeats itself; Skewed results
Systematic Error
What is the process of quality control?
To reduce and minimize errors
All variable measurements and manipulations are under the researcher's
control (Type of Studies)
Experimental Study
Used when impractical or impossible to control the conditions of the study
(Type of Studies)
Observational Study
Participants are not told if they are in the treatment group or control group
Blind Study
The procedure the researcher applies to each subject
Treatment
The treatment allocator or the participants do NOT know who is in the
treatment group or control group
Double blind study
, Questions favor an outcome, or the interviewer ask questions that favor an
outcome (bias)
Information Bias
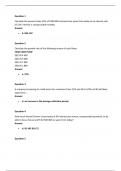
The average outcome (payoff) when the future includes scenarios that may or
may not happen
Expected Monetary Value (EMV)
Observation points that are distant form other observations; Can be included or
excluded in analysis (causes skewness)
Outliers
Bias that occurs from not selecting a random sample
Measurement bias
Bias introduced because respondents believe it will be beneficial if selected
Conscious bias
Middle score for a set of data (Descriptive Statistic Measurement)
MEDIAN
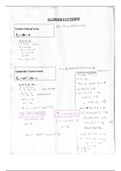
Tells us the number of standard deviations a data point is from the mean
Z-SCORE
If the average is the same for two groups, what will determine their difference?
VARIANCE (Standard Deviation)
The spread of data in a sample. How far the data points are from the mean.
Standard Deviation
Measure of central tendency that is influenced by the size of the values in a data
set; Is not affected by skewness
MEAN
Each of the four quartile group a population can be divided
Quartiles
EXAM: IN-DEPTH EXPLORATION OF DATA
ACQUISITION, INTERPRETATION, STATISTICAL
REASONING, AND APPLICATION FOR
ORGANIZATIONAL SUCCESS
There are two types of statistics (Analytics)
1. Descriptive
2. Inferential
Descriptive statistics are used to _________
Inform; Explain
Inferential statistics are used to ______
Predict/Show trend
Name the 4 levels of measurement
1. NOIR (Nominal)
2. Ordinal
3. Interval
Ratio
Continuous data with unique zero point (Level of Measurement)
Ratio
Orders data at EQUAL distance apart (Level of Measurement)
Interval
Place quantitative objects in some kind of order (Level of Measurement)
Ordinal
,Identify, Group, or Categorize (Level of Measurement)
Nominal
Outliers create this type of error
Out-of-Range
Unpredictable error/No correlation
Random Error
Error may occur from missing data. (EX: Space not filled in); Distorted results
Omission Error
This error repeats itself; Skewed results
Systematic Error
What is the process of quality control?
To reduce and minimize errors
All variable measurements and manipulations are under the researcher's
control (Type of Studies)
Experimental Study
Used when impractical or impossible to control the conditions of the study
(Type of Studies)
Observational Study
Participants are not told if they are in the treatment group or control group
Blind Study
The procedure the researcher applies to each subject
Treatment
The treatment allocator or the participants do NOT know who is in the
treatment group or control group
Double blind study
, Questions favor an outcome, or the interviewer ask questions that favor an
outcome (bias)
Information Bias
The average outcome (payoff) when the future includes scenarios that may or
may not happen
Expected Monetary Value (EMV)
Observation points that are distant form other observations; Can be included or
excluded in analysis (causes skewness)
Outliers
Bias that occurs from not selecting a random sample
Measurement bias
Bias introduced because respondents believe it will be beneficial if selected
Conscious bias
Middle score for a set of data (Descriptive Statistic Measurement)
MEDIAN
Tells us the number of standard deviations a data point is from the mean
Z-SCORE
If the average is the same for two groups, what will determine their difference?
VARIANCE (Standard Deviation)
The spread of data in a sample. How far the data points are from the mean.
Standard Deviation
Measure of central tendency that is influenced by the size of the values in a data
set; Is not affected by skewness
MEAN
Each of the four quartile group a population can be divided
Quartiles