www
eeerOxford Cambridge and RSA
Monday 12 May 2025 – Morning
reredfggfhgjjjjhhgfdda
Retgdgdgdvxdsdsdsdgdgdgdgdef
A Level Economics
A-Level OCR 2025 Economics
Paper 1
jhygdsasdfghjoiuytr
H460/01 Microeconomics
Time allowed: 2 hours
Please write clearly in black ink. Do not write in the barcodes.
Centre number Candidate number
First name(s)
Last name
INSTRUCTIONS
• Use black ink. You can use an HB pencil, but only for graphs and diagrams.
• Write your answer to each question in the space provided. If you need extra space use
the lined pages at the end of this booklet. The question numbers must be clearly
shown.
• Answer all the questions in Section A, one question in Section B and one question
in Section C.
INFORMATION
• The total mark for this paper is 80.
• The marks for each question are shown in brackets [ ].
• Quality of extended response will be assessed in questions marked with an asterisk (*).
• This document has 20 pages.
ADVICE
• Read each question carefully before you start your answer.
1 Turn over
, 2
Section A
Read the stimulus material and answer all the parts of Question 1.
Bottled water in the UK
Opinions often differ as to which is better, bottled or tap water? Bottled water has seen a huge
increase in its popularity in the last 50 years. Bottled water consumption in the UK has increased
from just one 300ml bottle per head in the mid-1970s to 37 litres a head in 2021, according to
Retail Economics’ chief executive.
It was often assumed that the biggest reason for the rise in sales of bottled water was its 5
convenience but studies have shown that over half of the plastic bottles were consumed in the
home. The consumption of plastic bottles creates external costs. Their production creates CO2
emissions and this environmental impact continues from their transportation right through to
when they are discarded. Some plastic bottles take over 500 years to decompose in landfill sites.
They are one of the most common items found in the stomachs of sea life such as dolphins and 10
whales.
With the UK having some of the cleanest tap water in the world, it is understandable why
environmental groups campaign against the use of plastic bottles for water. This would appear to
be an example of information failure in the consumption of water.
Branded water has been the driving force behind the growth in sales with Britons spending £1bn 15
out of a total market spend of £1.6bn on brands such as Evian and Volvic. 3.5 billion plastic water
bottles are consumed each year and 2.5 billion of these are from branded water bottles. Some
economists predict that with the trend in increased advertising by these water brands, this could
rise to 2.8bn bottles in 2028.
The UK Water industry
Both the market power and the environmental impact of the water industry have been a topic 20
of much debate in the UK recently. Water companies are permitted by the regulator to release
untreated sewage into the UK’s network of rivers and the sea when there are high levels of rainfall.
United Utilities recently paid out over £300m in dividends to its shareholders, yet, according to
data from the Environment agency it is one of England’s most polluting water companies.
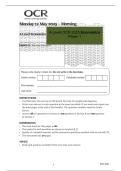
Fig. 1
Pollution incidents by water companies 2020
Incidents per 10,000 km (6,214 miles) of sewers in 2020
South West 131
Southern 102
Anglian 28
Thames 27
Wessex 25
Yorkshire 24
Severn Trent 21
United Utilities 19
Northumbrian 14
© OCR 2025
, 3
Over 200 000 people work in the industry itself, or in related employment. The industry has 25
been striving to achieve a net zero carbon emission target by 2030 with initiatives such as
increased renewable energy generation, planting trees to restore original woodland habitats and
encouraging consumers to reduce water consumption.
The English and Welsh water industry was privatised in 1989. Most water and sewage
companies act as regional monopolies. Each has their own dedicated set of pipes providing 30
water into their area.
Fig. 2
Overflowing with cash
Operating
Company Revenue (£)
profit (£)
Anglian Water 1.4bn 392m
Northumbrian Water 758m 195m
Severn Trent Water 1.7bn 458m
Southern Water 820m 139m
South West Water 544m 198m
Thames Water 2.1bn 489m
United Utilities 1.8bn 602m
Wessex Water 517m 160m
Yorkshire Water 1.1bn 241m
Total 10.7bn 2.8bn
Regulation of the water industry
The industry is regulated by the office of the water regulator (OFWAT) which is responsible
for ensuring that the industry delivers good value for consumers and the environment. Where
appropriate they will also promote competition in the market. Critics of privatisation have long
argued that an industry such as water, where the need for infrastructure makes competition 35
almost impossible, should have remained under government control.
Recently OFWAT has been accused of having too close a relationship with the biggest water
companies. Two thirds of water companies employ former OFWAT employees in senior executive
roles within their companies. One of the biggest water companies, Thames Water, is on the brink
of collapse with around £14bn of debts. 40
The regulator has allowed the water companies to raise prices since privatisation. The average
water bill has risen in real terms since 1989 but has remained stable since 2010. Water
companies argue that price rises are needed to fund investment into infrastructure and to
improve the quality of drinking water.
© OCR 2025 Turn over
eeerOxford Cambridge and RSA
Monday 12 May 2025 – Morning
reredfggfhgjjjjhhgfdda
Retgdgdgdvxdsdsdsdgdgdgdgdef
A Level Economics
A-Level OCR 2025 Economics
Paper 1
jhygdsasdfghjoiuytr
H460/01 Microeconomics
Time allowed: 2 hours
Please write clearly in black ink. Do not write in the barcodes.
Centre number Candidate number
First name(s)
Last name
INSTRUCTIONS
• Use black ink. You can use an HB pencil, but only for graphs and diagrams.
• Write your answer to each question in the space provided. If you need extra space use
the lined pages at the end of this booklet. The question numbers must be clearly
shown.
• Answer all the questions in Section A, one question in Section B and one question
in Section C.
INFORMATION
• The total mark for this paper is 80.
• The marks for each question are shown in brackets [ ].
• Quality of extended response will be assessed in questions marked with an asterisk (*).
• This document has 20 pages.
ADVICE
• Read each question carefully before you start your answer.
1 Turn over
, 2
Section A
Read the stimulus material and answer all the parts of Question 1.
Bottled water in the UK
Opinions often differ as to which is better, bottled or tap water? Bottled water has seen a huge
increase in its popularity in the last 50 years. Bottled water consumption in the UK has increased
from just one 300ml bottle per head in the mid-1970s to 37 litres a head in 2021, according to
Retail Economics’ chief executive.
It was often assumed that the biggest reason for the rise in sales of bottled water was its 5
convenience but studies have shown that over half of the plastic bottles were consumed in the
home. The consumption of plastic bottles creates external costs. Their production creates CO2
emissions and this environmental impact continues from their transportation right through to
when they are discarded. Some plastic bottles take over 500 years to decompose in landfill sites.
They are one of the most common items found in the stomachs of sea life such as dolphins and 10
whales.
With the UK having some of the cleanest tap water in the world, it is understandable why
environmental groups campaign against the use of plastic bottles for water. This would appear to
be an example of information failure in the consumption of water.
Branded water has been the driving force behind the growth in sales with Britons spending £1bn 15
out of a total market spend of £1.6bn on brands such as Evian and Volvic. 3.5 billion plastic water
bottles are consumed each year and 2.5 billion of these are from branded water bottles. Some
economists predict that with the trend in increased advertising by these water brands, this could
rise to 2.8bn bottles in 2028.
The UK Water industry
Both the market power and the environmental impact of the water industry have been a topic 20
of much debate in the UK recently. Water companies are permitted by the regulator to release
untreated sewage into the UK’s network of rivers and the sea when there are high levels of rainfall.
United Utilities recently paid out over £300m in dividends to its shareholders, yet, according to
data from the Environment agency it is one of England’s most polluting water companies.
Fig. 1
Pollution incidents by water companies 2020
Incidents per 10,000 km (6,214 miles) of sewers in 2020
South West 131
Southern 102
Anglian 28
Thames 27
Wessex 25
Yorkshire 24
Severn Trent 21
United Utilities 19
Northumbrian 14
© OCR 2025
, 3
Over 200 000 people work in the industry itself, or in related employment. The industry has 25
been striving to achieve a net zero carbon emission target by 2030 with initiatives such as
increased renewable energy generation, planting trees to restore original woodland habitats and
encouraging consumers to reduce water consumption.
The English and Welsh water industry was privatised in 1989. Most water and sewage
companies act as regional monopolies. Each has their own dedicated set of pipes providing 30
water into their area.
Fig. 2
Overflowing with cash
Operating
Company Revenue (£)
profit (£)
Anglian Water 1.4bn 392m
Northumbrian Water 758m 195m
Severn Trent Water 1.7bn 458m
Southern Water 820m 139m
South West Water 544m 198m
Thames Water 2.1bn 489m
United Utilities 1.8bn 602m
Wessex Water 517m 160m
Yorkshire Water 1.1bn 241m
Total 10.7bn 2.8bn
Regulation of the water industry
The industry is regulated by the office of the water regulator (OFWAT) which is responsible
for ensuring that the industry delivers good value for consumers and the environment. Where
appropriate they will also promote competition in the market. Critics of privatisation have long
argued that an industry such as water, where the need for infrastructure makes competition 35
almost impossible, should have remained under government control.
Recently OFWAT has been accused of having too close a relationship with the biggest water
companies. Two thirds of water companies employ former OFWAT employees in senior executive
roles within their companies. One of the biggest water companies, Thames Water, is on the brink
of collapse with around £14bn of debts. 40
The regulator has allowed the water companies to raise prices since privatisation. The average
water bill has risen in real terms since 1989 but has remained stable since 2010. Water
companies argue that price rises are needed to fund investment into infrastructure and to
improve the quality of drinking water.
© OCR 2025 Turn over