EDEXCEL A LEVEL EXAMINATION MATERIALS
MAY-JUNE 2025 SERIES
BY TYRION LAY
Past Papers • Mark Schemes • Examiner Reports
Compiled for student use and revision purposes.
Website: tyrionpapers.com
Email:
Instagram: @tyrionpapers_official
, Please check the examination details below before entering your candidate information
Candidate surname Other names
Centre Number Candidate Number
Pearson Edexcel Level 3 GCE
Thursday 22 May 2025
Afternoon (Time: 2 hours 15 minutes) Paper
reference 9GE0/02
Geography
Advanced
PAPER 2
You must have: Total Marks
Resource Booklet (enclosed)
Calculator, ruler
Instructions
•• Use black ink or ball-point pen.
Fill in the boxes at the top of this page with your name,
centre number and candidate number.
•• Answer all questions in Section A.
Answer one question in Section B and one question in Section C.
• Answer the questions in the spaces provided
– there may be more space than you need.
• Any calculations must show all stages of working out and a clear answer.
Information
•• The total mark for this paper is 105.
The marks for each question are shown in brackets
– use this as a guide as to how much time to spend on each question.
• Calculators may be used.
Advice
•• Read each question carefully before you start to answer it.
Check your answers if you have time at the end.
Turn over
P78681A
©2025 Pearson Education Ltd.
Y:1/1/1/1/1/1/1/1
*P78681A0140* for more resources: tyrionpapers.com
, SECTION A
Globalisation / Superpowers
DO NOT WRITE IN THIS AREA DO NOT WRITE IN THIS AREA DO NOT WRITE IN THIS AREA
Answer ALL questions in this section. Write your answers in the spaces provided.
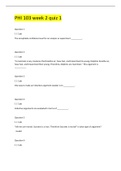
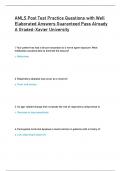
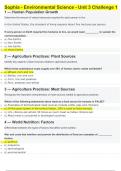
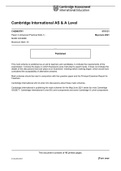
1 Study Figures 1a and 1b below.
100
90
80
70 Line of equality
(no income inequality)
60
Cumulative
share of 50
income (%)
40
30
20
10
0
0 20 40 60 80 100
Cumulative share of population from poorest to richest (%)
Figure 1a
Lorenz curve showing income distribution of Brazil’s population, 2019
Cumulative share of Cumulative share of
population percentage income percentage
(%) (%)
0 0
20 3
40 10
60 24
80 41
100 100
Figure 1b
Gini Coefficient data for Brazil, 2019
2 for more resources: tyrionpapers.com
*P78681A0240*
, (a) Complete the Lorenz curve on Figure 1a;
(i) Plot the cumulative share of income for 60% of the population.
DO NOT WRITE IN THIS AREA DO NOT WRITE IN THIS AREA DO NOT WRITE IN THIS AREA
(1)
(ii) Complete the Lorenz curve to show income distribution in Brazil.
(1)
(iii) Calculate the percentage of income for the poorest 30%.
(1)
.............................................. . . . . . . . . . . . . . . . . %
(iv) Calculate the percentage of income for the richest 10%.
(1)
.............................................. . . . . . . . . . . . . . . . . %
for more resources: tyrionpapers.com
3
*P78681A0340* Turn over
MAY-JUNE 2025 SERIES
BY TYRION LAY
Past Papers • Mark Schemes • Examiner Reports
Compiled for student use and revision purposes.
Website: tyrionpapers.com
Email:
Instagram: @tyrionpapers_official
, Please check the examination details below before entering your candidate information
Candidate surname Other names
Centre Number Candidate Number
Pearson Edexcel Level 3 GCE
Thursday 22 May 2025
Afternoon (Time: 2 hours 15 minutes) Paper
reference 9GE0/02
Geography
Advanced
PAPER 2
You must have: Total Marks
Resource Booklet (enclosed)
Calculator, ruler
Instructions
•• Use black ink or ball-point pen.
Fill in the boxes at the top of this page with your name,
centre number and candidate number.
•• Answer all questions in Section A.
Answer one question in Section B and one question in Section C.
• Answer the questions in the spaces provided
– there may be more space than you need.
• Any calculations must show all stages of working out and a clear answer.
Information
•• The total mark for this paper is 105.
The marks for each question are shown in brackets
– use this as a guide as to how much time to spend on each question.
• Calculators may be used.
Advice
•• Read each question carefully before you start to answer it.
Check your answers if you have time at the end.
Turn over
P78681A
©2025 Pearson Education Ltd.
Y:1/1/1/1/1/1/1/1
*P78681A0140* for more resources: tyrionpapers.com
, SECTION A
Globalisation / Superpowers
DO NOT WRITE IN THIS AREA DO NOT WRITE IN THIS AREA DO NOT WRITE IN THIS AREA
Answer ALL questions in this section. Write your answers in the spaces provided.
1 Study Figures 1a and 1b below.
100
90
80
70 Line of equality
(no income inequality)
60
Cumulative
share of 50
income (%)
40
30
20
10
0
0 20 40 60 80 100
Cumulative share of population from poorest to richest (%)
Figure 1a
Lorenz curve showing income distribution of Brazil’s population, 2019
Cumulative share of Cumulative share of
population percentage income percentage
(%) (%)
0 0
20 3
40 10
60 24
80 41
100 100
Figure 1b
Gini Coefficient data for Brazil, 2019
2 for more resources: tyrionpapers.com
*P78681A0240*
, (a) Complete the Lorenz curve on Figure 1a;
(i) Plot the cumulative share of income for 60% of the population.
DO NOT WRITE IN THIS AREA DO NOT WRITE IN THIS AREA DO NOT WRITE IN THIS AREA
(1)
(ii) Complete the Lorenz curve to show income distribution in Brazil.
(1)
(iii) Calculate the percentage of income for the poorest 30%.
(1)
.............................................. . . . . . . . . . . . . . . . . %
(iv) Calculate the percentage of income for the richest 10%.
(1)
.............................................. . . . . . . . . . . . . . . . . %
for more resources: tyrionpapers.com
3
*P78681A0340* Turn over