Visuals & Descriptive
Lecture 6.1
Chapter [Paragraph]:
2 [1-2]
3 [1-2-3-4-5-6-7-8-9]
4 [1-2-3-5-6-8]
2.1 Variables and Data
Data Terminology
Observation = A single member of a collection of items that we wat to study, such as a person, firm,
or region.
Variable = A characteristic of the subject or individual.
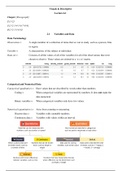
Data set = Consists of all the values of all of the variables for all of the observations that were
chosen to observe. These values are entered in a ‘n x m’ matrix.
Categorical and Numerical Data
Categorical (qualitative) = Have values that are described by words rather than numbers.
Coding = When categorical variables are represented by numbers. It does not make the
data numerical.
Binary variables = When categorical variables only have two values.
Numerical (quantitative) = Arise from counting or measuring.
Discrete data = Variables with countable numbers.
Continuous data = Variables with values within an interval.
,Time Series Data and Cross-Sectional Data
Time series data = An observation representing a different equally spaced point in time.
- Interested in trends and patterns over time.
Periodicity = Time between these observations.
Cross-sectional data = An observation representing different individual units (e.g., a person, firm …)
- Interested in variations and relationships between variables.
2.2 Level of Measurement
Nominal Measurement
Nominal measurement is the weakest level of measurement and the easiest to recognize. It is used as
a placeholder for values of variables.
Ordinal Measurement
Ordinal data codes connote a ranking of data values. (for instance: Moody’s Bond ratings)
Interval Measurement
When the ranking of data values contains meaningful intervals between scale points but does not
have a Zero Point. (for instance: the scale of Fahrenheit has no beginning or end)
Likert scales =
Coarseness of a Likert scale = Number of scale points.
Ratio Measurement
Ratio measurement is the strongest level of data measurement. It has all properties of the other three
data types, but in addition possesses a meaningful zero which represents the absence of the quality
being measured. Because of the zero point, ratios of data values are meaningful. (20 books are twice
as much as 10 books.)
, 3.1 Stem-and-Leaf Displays and Dot Plots
Stem-and-Leaf Display
Stem-and-leaf plot = A tool of exploratory data analyses (EDA) that seeks to reveal essential data
features in an intuitive way. A stem-and-leaf plot is basically a frequency tally,
except that it uses digits instead of tally marks.
Stem = The tens digit of the data.
Leaf = The digits within the stem.
Dot Plots
Dot plot = A graphical display of ‘n’ individual values of numerical data. Dot plots are an
attractive tool for data exploration because they are easy to understand. A dot plot
shows variability, the center, and can show the shape of the distribution.
Stacked dot plot = Compare two or more groups.
Basic steps for making a dot plot:
I. Make a scale that covers the data range
II. Mark axis demarcations and label them
III. Plot each data value as a dot above the scale at its approximate location.
If 1+ data values lie around the same X-axis location, the dots are piled up vertically.
3.2 Frequency Distributions and Histograms
Frequency Distributions
A frequency distribution is a table formed by classifying ‘n’ data values into ‘k’ classes called bins (as called
in Excel). The bin limits define the values to be included in each bin. Usually, all the bin widths are the
same. The table shows the frequency of data values within each bin. Frequencies can also be expressed as
relative frequencies or percentages of the total number of observations.
Lecture 6.1
Chapter [Paragraph]:
2 [1-2]
3 [1-2-3-4-5-6-7-8-9]
4 [1-2-3-5-6-8]
2.1 Variables and Data
Data Terminology
Observation = A single member of a collection of items that we wat to study, such as a person, firm,
or region.
Variable = A characteristic of the subject or individual.
Data set = Consists of all the values of all of the variables for all of the observations that were
chosen to observe. These values are entered in a ‘n x m’ matrix.
Categorical and Numerical Data
Categorical (qualitative) = Have values that are described by words rather than numbers.
Coding = When categorical variables are represented by numbers. It does not make the
data numerical.
Binary variables = When categorical variables only have two values.
Numerical (quantitative) = Arise from counting or measuring.
Discrete data = Variables with countable numbers.
Continuous data = Variables with values within an interval.
,Time Series Data and Cross-Sectional Data
Time series data = An observation representing a different equally spaced point in time.
- Interested in trends and patterns over time.
Periodicity = Time between these observations.
Cross-sectional data = An observation representing different individual units (e.g., a person, firm …)
- Interested in variations and relationships between variables.
2.2 Level of Measurement
Nominal Measurement
Nominal measurement is the weakest level of measurement and the easiest to recognize. It is used as
a placeholder for values of variables.
Ordinal Measurement
Ordinal data codes connote a ranking of data values. (for instance: Moody’s Bond ratings)
Interval Measurement
When the ranking of data values contains meaningful intervals between scale points but does not
have a Zero Point. (for instance: the scale of Fahrenheit has no beginning or end)
Likert scales =
Coarseness of a Likert scale = Number of scale points.
Ratio Measurement
Ratio measurement is the strongest level of data measurement. It has all properties of the other three
data types, but in addition possesses a meaningful zero which represents the absence of the quality
being measured. Because of the zero point, ratios of data values are meaningful. (20 books are twice
as much as 10 books.)
, 3.1 Stem-and-Leaf Displays and Dot Plots
Stem-and-Leaf Display
Stem-and-leaf plot = A tool of exploratory data analyses (EDA) that seeks to reveal essential data
features in an intuitive way. A stem-and-leaf plot is basically a frequency tally,
except that it uses digits instead of tally marks.
Stem = The tens digit of the data.
Leaf = The digits within the stem.
Dot Plots
Dot plot = A graphical display of ‘n’ individual values of numerical data. Dot plots are an
attractive tool for data exploration because they are easy to understand. A dot plot
shows variability, the center, and can show the shape of the distribution.
Stacked dot plot = Compare two or more groups.
Basic steps for making a dot plot:
I. Make a scale that covers the data range
II. Mark axis demarcations and label them
III. Plot each data value as a dot above the scale at its approximate location.
If 1+ data values lie around the same X-axis location, the dots are piled up vertically.
3.2 Frequency Distributions and Histograms
Frequency Distributions
A frequency distribution is a table formed by classifying ‘n’ data values into ‘k’ classes called bins (as called
in Excel). The bin limits define the values to be included in each bin. Usually, all the bin widths are the
same. The table shows the frequency of data values within each bin. Frequencies can also be expressed as
relative frequencies or percentages of the total number of observations.