MAT-15403
Summary: Statistics 2
,Tutorial 1: Normal(standard) distribution and calculating probability
(with samples)
Normal Distribution (introduction) is:
• Symmetrical
• Bell-shaped
• Uni-modal
• Parameters of the ND: determine shape
o 𝝁: mean of the population - is the expected value of y
▪ Medium of normal distribution
o y: the variable of interest - e.g. variation weight of an
apple
o 𝝈: standard deviation of population
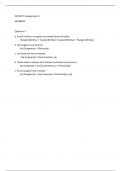
E.g. weight of an apple normally distributed:
• Variable y is normally distributed with parameters 𝜇 and 𝜎 in the
population of apples.
• Examples of two different expressions:
o because the 𝝁 is lower with the elstar, the graph is depicted more to the lef-hand
side → determines the position!
o because the 𝝈 is lower with the elstar, the graph is more pointy. → determines the
width!
Examples of calculating probabilities with:
- What is the probability of P x<4 with a normal distribution with a mean of 5 (𝜇) and a
standard deviation of 2 (𝜎)?
- Answer:
𝑋− 𝜇 4− 5
1. Calculate the Z-value: 𝑍 = 𝜎 → 2 = -0.5
2. Check Z-table: -0.5 gives 0.3085
3. Since the P x< we don’t have to substract this value from a 1 (in case that the
question was posed with P x> then we still had to subtract the retrieved z-value
from 1.
,- Calculate the probability of a Standard Normal Distribution where the value is >1.5
- Answer:
1. Check what the mean (𝜇) and a standard deviation of (𝜎) are. → for a standard
normal distribution this is always 0 (𝜇) and 1 (𝜎).
𝑋− 𝜇 1.5− 0
2. Calculate the Z-value: 𝑍 = 𝜎 → 1 = 1.5
3. Check Z-table: 1.5 gives 0.9332
4. Since P x> then we still have to subtract the retrieved z-value from 1. → 1 –
0.9332 = 0.0668
- Calculate the probability of someone becoming 82 in a population where the average age is
76 (𝜇) with a standard deviation of 2.7 (𝜎).
- Answer:
𝑋− 𝜇 82− 76
1. Calculate the Z-value: 𝑍 = 𝜎 → 2.7 = 2.222222222222
2. Check Z-table: 2.2222222 gives 0.9868
3. Since P x> then we still have to subtract the retrieved z-value from 1. → 1 –
0.9868 = 0.0132
• Acrylamide: research question
o Research question: How much is the acrylamide content (μg/g) of baked potatoes
and what relation is there between acrylamide and other quality features?
o Important: What is our target group for which we need to answer this question?
▪ For example: all “home bakers” in the Netherlands
o Population = all households in the Netherlands that bake potatoes
o Unit: household (that bakes potatoes)
o Sample: selection of units from the population (for example: Simple Random Sample
= SRS)
o Variable: property of a unit from the sample
▪ Various variables are possible to be measured
> either:
> Qualitative:
o nominal (there is no natural order)
o ordinal
> Quantitative:
> discreet: can only take certain values (like
whole numbers)
> continuous (all possible outcomes would be
possible – within a range)
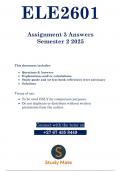
,▪ Visualization of quantitative variables:
Lots of observations also yields more classes and therefore more
nuance! The more classes the more the histogram becomes a curve →
the Probability Density Function
▪ Continuous random variable:
!! → 1 represents a 100% chance of it happening.
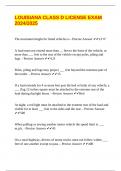
,• Normal distribution:
o Standard Normal distribution:
▪ Mean(𝜇) is 0
▪ Standard deviation (𝜎) is 1
,o Examples:
o Transformation to a standard Normal distribution: KEY
, o Calculation of probabilities:
!! – Just use 3 steps as depicted on page 2!
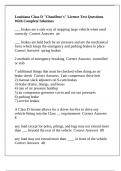
• Normal – Quantile Plot (Q-Q plot)
o Are observations normally distributed?
Key! →
o The example of the Acrylamide content: the population is definitely not normally
distributed as can be seen below! → Dots are not on the line
Summary: Statistics 2
,Tutorial 1: Normal(standard) distribution and calculating probability
(with samples)
Normal Distribution (introduction) is:
• Symmetrical
• Bell-shaped
• Uni-modal
• Parameters of the ND: determine shape
o 𝝁: mean of the population - is the expected value of y
▪ Medium of normal distribution
o y: the variable of interest - e.g. variation weight of an
apple
o 𝝈: standard deviation of population
E.g. weight of an apple normally distributed:
• Variable y is normally distributed with parameters 𝜇 and 𝜎 in the
population of apples.
• Examples of two different expressions:
o because the 𝝁 is lower with the elstar, the graph is depicted more to the lef-hand
side → determines the position!
o because the 𝝈 is lower with the elstar, the graph is more pointy. → determines the
width!
Examples of calculating probabilities with:
- What is the probability of P x<4 with a normal distribution with a mean of 5 (𝜇) and a
standard deviation of 2 (𝜎)?
- Answer:
𝑋− 𝜇 4− 5
1. Calculate the Z-value: 𝑍 = 𝜎 → 2 = -0.5
2. Check Z-table: -0.5 gives 0.3085
3. Since the P x< we don’t have to substract this value from a 1 (in case that the
question was posed with P x> then we still had to subtract the retrieved z-value
from 1.
,- Calculate the probability of a Standard Normal Distribution where the value is >1.5
- Answer:
1. Check what the mean (𝜇) and a standard deviation of (𝜎) are. → for a standard
normal distribution this is always 0 (𝜇) and 1 (𝜎).
𝑋− 𝜇 1.5− 0
2. Calculate the Z-value: 𝑍 = 𝜎 → 1 = 1.5
3. Check Z-table: 1.5 gives 0.9332
4. Since P x> then we still have to subtract the retrieved z-value from 1. → 1 –
0.9332 = 0.0668
- Calculate the probability of someone becoming 82 in a population where the average age is
76 (𝜇) with a standard deviation of 2.7 (𝜎).
- Answer:
𝑋− 𝜇 82− 76
1. Calculate the Z-value: 𝑍 = 𝜎 → 2.7 = 2.222222222222
2. Check Z-table: 2.2222222 gives 0.9868
3. Since P x> then we still have to subtract the retrieved z-value from 1. → 1 –
0.9868 = 0.0132
• Acrylamide: research question
o Research question: How much is the acrylamide content (μg/g) of baked potatoes
and what relation is there between acrylamide and other quality features?
o Important: What is our target group for which we need to answer this question?
▪ For example: all “home bakers” in the Netherlands
o Population = all households in the Netherlands that bake potatoes
o Unit: household (that bakes potatoes)
o Sample: selection of units from the population (for example: Simple Random Sample
= SRS)
o Variable: property of a unit from the sample
▪ Various variables are possible to be measured
> either:
> Qualitative:
o nominal (there is no natural order)
o ordinal
> Quantitative:
> discreet: can only take certain values (like
whole numbers)
> continuous (all possible outcomes would be
possible – within a range)
,▪ Visualization of quantitative variables:
Lots of observations also yields more classes and therefore more
nuance! The more classes the more the histogram becomes a curve →
the Probability Density Function
▪ Continuous random variable:
!! → 1 represents a 100% chance of it happening.
,• Normal distribution:
o Standard Normal distribution:
▪ Mean(𝜇) is 0
▪ Standard deviation (𝜎) is 1
,o Examples:
o Transformation to a standard Normal distribution: KEY
, o Calculation of probabilities:
!! – Just use 3 steps as depicted on page 2!
• Normal – Quantile Plot (Q-Q plot)
o Are observations normally distributed?
Key! →
o The example of the Acrylamide content: the population is definitely not normally
distributed as can be seen below! → Dots are not on the line