Lecture video’s summary MRM2
Premaster Business Administration 2020-2021
Shannon Karhof – Grade 8.2
Table of contents
Week 1 – Conceptual models & analysis of variance..............................................................................2
Week 2 – Moderation in ANOVA = 2-way independent ANOVA..........................................................12
Week 3 – Regression............................................................................................................................21
Week 4 – Multicollinearity....................................................................................................................35
Week 5 – Regression complications.....................................................................................................38
Week 6 – Logistic Regression................................................................................................................46
MRM 2 lecture video’s
,Week 1 – Conceptual models & analysis of variance
Diagnostic + Predictive analytics
Is the focus of this course. Descriptive analytics was MRM1.
OV=outcome variable/DV=dependent variable (numerical)
What you are testing
PV = predictor/IV=independent variable (categorical/numerical)
What is trying to explain the OV
Null hypothesis
The opposite of what you want to find. Always look at the alternative hypothesis first.
P-value (0.05)
The probability of obtaining a result. What was actually observed, assuming the null hypothesis is
true. A low p value indicates the null hypothesis is unlikely.
Conceptual models (ANOVA/Regression)
Visual representations of relations between theoretical constructs (and variables) of interest.
In research: ‘model’ = a simplified description of reality
- You have 1 OV and 1 or many PV’s in a model
- In a model you only have 1 OV, as you can’t explain multiple things at the same time.
- OV’s are mostly quantitative
- PV’s could be quantitative or numerical
Different measurement scales of variables in conceptual models
- Categorical (nominal, ordinal) subgroups are indicated by numbers
- Quantitative (discrete, interval, ratio) we use equal distances between values
o Ordinal scales
Sometimes treated as interval scales: e.g. Likert scales (1-to-7 or 1-to-5)
Should also be treated as numerical variables.
Example:
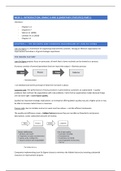
,RQ: what factors determine student satisfaction
Variables
Commitment of teacher quantitative
Student satisfaction quantitative
H0: teachers that are more committed do not increase the satisfaction level of students
H1: teachers that are more committed will increase the satisfaction level of students
H2: teachers that are more committed will increase the satisfaction level of students, when they have
good communication skills
Moderator
When one variable affects the two other variables’ relationship.
Communication skills in this model acts as a moderator. It affects the other two variables
H3: the positive effect of teacher’s commitment on student satisfaction is mediated by quality of the
course material
Mediating variable = the indirect effect
One variable mediates the relationship between two other variables
Here the quality of lecture slides is a mediating variable. Commitment of teacher affects quality of
lecture slides and quality of lecture slides affects student satisfaction.
ANOVA
, It examines how much of the variability in our dependent variable can be explained by our
independent variable.
Analysis of variance. Two measurements of Variability (how much values differ in your data)
In order to see a statistical difference between groups, you need to run an ANOVA test.
It gives you a confirmation.
- It looks at variability between the groups as high as possible
versus variability within the groups as low as possible (similar groups)
- Variance
The average of the squared differences from the mean
- Sum of squares
- It breaks down different measures of variability through calculating the sum of the squared
differences from the mean (average).
Example
RQ: Does it matter in which group you are with regards to your exam score?
Outcome variable = exam scores
- The green group is significantly statistically different from the purple group. Both extreme.
- There is an overlap between red and purple thus there may not be a difference look at the
results to draw a conclusion
When to use (one way) ANOVA? (Sampling assumptions = do this when collecting data)
- Outcome variable = quantitative
- Predictor variable = categorical with more than 2 groups
- Variance = homogenous across groups only check before analysis
- Residuals = normally distributed
- Groups = roughly equal size
- Subject = can only be in one group
Premaster Business Administration 2020-2021
Shannon Karhof – Grade 8.2
Table of contents
Week 1 – Conceptual models & analysis of variance..............................................................................2
Week 2 – Moderation in ANOVA = 2-way independent ANOVA..........................................................12
Week 3 – Regression............................................................................................................................21
Week 4 – Multicollinearity....................................................................................................................35
Week 5 – Regression complications.....................................................................................................38
Week 6 – Logistic Regression................................................................................................................46
MRM 2 lecture video’s
,Week 1 – Conceptual models & analysis of variance
Diagnostic + Predictive analytics
Is the focus of this course. Descriptive analytics was MRM1.
OV=outcome variable/DV=dependent variable (numerical)
What you are testing
PV = predictor/IV=independent variable (categorical/numerical)
What is trying to explain the OV
Null hypothesis
The opposite of what you want to find. Always look at the alternative hypothesis first.
P-value (0.05)
The probability of obtaining a result. What was actually observed, assuming the null hypothesis is
true. A low p value indicates the null hypothesis is unlikely.
Conceptual models (ANOVA/Regression)
Visual representations of relations between theoretical constructs (and variables) of interest.
In research: ‘model’ = a simplified description of reality
- You have 1 OV and 1 or many PV’s in a model
- In a model you only have 1 OV, as you can’t explain multiple things at the same time.
- OV’s are mostly quantitative
- PV’s could be quantitative or numerical
Different measurement scales of variables in conceptual models
- Categorical (nominal, ordinal) subgroups are indicated by numbers
- Quantitative (discrete, interval, ratio) we use equal distances between values
o Ordinal scales
Sometimes treated as interval scales: e.g. Likert scales (1-to-7 or 1-to-5)
Should also be treated as numerical variables.
Example:
,RQ: what factors determine student satisfaction
Variables
Commitment of teacher quantitative
Student satisfaction quantitative
H0: teachers that are more committed do not increase the satisfaction level of students
H1: teachers that are more committed will increase the satisfaction level of students
H2: teachers that are more committed will increase the satisfaction level of students, when they have
good communication skills
Moderator
When one variable affects the two other variables’ relationship.
Communication skills in this model acts as a moderator. It affects the other two variables
H3: the positive effect of teacher’s commitment on student satisfaction is mediated by quality of the
course material
Mediating variable = the indirect effect
One variable mediates the relationship between two other variables
Here the quality of lecture slides is a mediating variable. Commitment of teacher affects quality of
lecture slides and quality of lecture slides affects student satisfaction.
ANOVA
, It examines how much of the variability in our dependent variable can be explained by our
independent variable.
Analysis of variance. Two measurements of Variability (how much values differ in your data)
In order to see a statistical difference between groups, you need to run an ANOVA test.
It gives you a confirmation.
- It looks at variability between the groups as high as possible
versus variability within the groups as low as possible (similar groups)
- Variance
The average of the squared differences from the mean
- Sum of squares
- It breaks down different measures of variability through calculating the sum of the squared
differences from the mean (average).
Example
RQ: Does it matter in which group you are with regards to your exam score?
Outcome variable = exam scores
- The green group is significantly statistically different from the purple group. Both extreme.
- There is an overlap between red and purple thus there may not be a difference look at the
results to draw a conclusion
When to use (one way) ANOVA? (Sampling assumptions = do this when collecting data)
- Outcome variable = quantitative
- Predictor variable = categorical with more than 2 groups
- Variance = homogenous across groups only check before analysis
- Residuals = normally distributed
- Groups = roughly equal size
- Subject = can only be in one group