AP PHYSICS 1 Test Booklet
Classwork - unit 3
1.
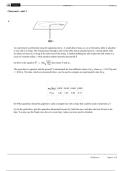
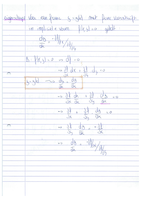
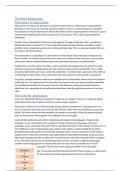
An experiment is performed using the apparatus above. A small disk of mass m1 on a frictionless table is attached
to one end of a string. The string passes through a hole in the table and an attached narrow, vertical plastic tube.
An object of mass m2 is hung at the other end of the string. A student holding the tube makes the disk rotate in a
circle of constant radius r, while another student measures the period P.
(a) Derive the equation that relates P and m2.
The procedure is repeated, and the period P is determined for four different values of m2, where m1 = 0.012 kg and
r = 0.80 m. The data, which are presented below, can be used to compute an experimental value for g.
0.020 0.040 0.060 0.080
P (s) 1.40 1.05 0.80 0.75
(b) What quantities should be graphed to yield a straight line with a slope that could be used to determine g ?
(c) On the grid below, plot the quantities determined in part (b), label the axes, and draw the best-fit line to the
data. You may use the blank rows above to record any values you may need to calculate.
AP Physics 1 Page 1 of 2
Classwork - unit 3
1.
An experiment is performed using the apparatus above. A small disk of mass m1 on a frictionless table is attached
to one end of a string. The string passes through a hole in the table and an attached narrow, vertical plastic tube.
An object of mass m2 is hung at the other end of the string. A student holding the tube makes the disk rotate in a
circle of constant radius r, while another student measures the period P.
(a) Derive the equation that relates P and m2.
The procedure is repeated, and the period P is determined for four different values of m2, where m1 = 0.012 kg and
r = 0.80 m. The data, which are presented below, can be used to compute an experimental value for g.
0.020 0.040 0.060 0.080
P (s) 1.40 1.05 0.80 0.75
(b) What quantities should be graphed to yield a straight line with a slope that could be used to determine g ?
(c) On the grid below, plot the quantities determined in part (b), label the axes, and draw the best-fit line to the
data. You may use the blank rows above to record any values you may need to calculate.
AP Physics 1 Page 1 of 2