Human-Machine Systems (ME41080)
Homework Assignment 1
Due to:18.12.2020
,OPEN QUESTIONS
Question 1 – Learning and individual differences (2.5 credits)
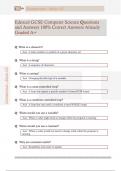
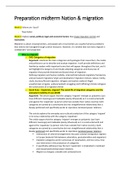
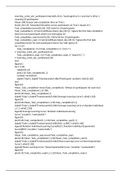
In Figure 1, I showed the code that I have created for power law and exponential law. In this code, at first, I
created a column matrix that contains random exponential numbers having an average of 1 as learning
constant for 20 participants. Then I have placed the initial conditions that have a mean of 100s and a standard
deviation of 25s on Trial 1 for all participants. Then I have created a zero-matrix called task_completion that
indicates 20 participants (20 rows) and 20 trials (20 columns) for bot exponential and power law. Since we
know the mean, standard deviation value, then I created normal distribution to find the task completion time
on Trial1 for each participant. Later on, in the first if loop I created the power-law formula to find out the time
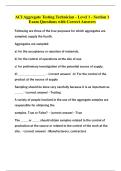
on other trials as well as the exponential law formula under it. In the second if loop, I created subplots of each
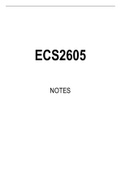
participant learning curve using power law. Then I have plotted the mean learning curve as well as the mean
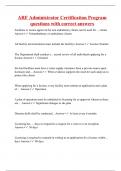
learning curve with the learning curve of a random individual. Later on, I plotted the same individual’s learning
curve using power-law and exponential law. In the end, I have plotted the mean graphs of both exponential
and power law.
Figure 1: Code for Power law and
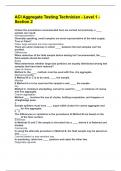
Figure 2: Learning curve of 20
exponential law
individuals
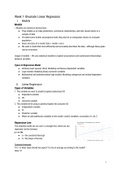
Figure 3: Mean learning curve Figure 4: Mean learning curve with random
individual’s learning curve
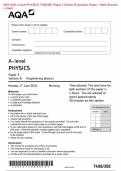
, Figure 5: Random individual’s learning Figure 6: Mean learning curve with mean
curve with random individual’s exponential exponential curve
curve for the same individual
Figure 7: Random individual’s exponential
curve with mean exponential curve
Heathcote et al. (2000) showed in their conducted experiment that when three-parameter function of both
power-law and exponential law were compared, exponential law showed better results in around 80% of the
cases. Also, they thought that parameter estimates from power law can be not related to underlying learning.
[1] Additionally, Anderson (2001) found out that averaging different kinds of curve shapes tend to give power-
like functions. [2] Furthermore, Myung et al. (2000) worked to find why averaged curves give a bitter fit for
power-law when compared with exponential law. [3] Moreover, Murre and Chessa (2011) showed in their
study that when there are more than a few participants, the power function fits better than the exponential. [4]
If we look at the variance and number of participant graph of power-law and exponential law, we can see that
exponential law works better for 4 or less than 4 participants.
Homework Assignment 1
Due to:18.12.2020
,OPEN QUESTIONS
Question 1 – Learning and individual differences (2.5 credits)
In Figure 1, I showed the code that I have created for power law and exponential law. In this code, at first, I
created a column matrix that contains random exponential numbers having an average of 1 as learning
constant for 20 participants. Then I have placed the initial conditions that have a mean of 100s and a standard
deviation of 25s on Trial 1 for all participants. Then I have created a zero-matrix called task_completion that
indicates 20 participants (20 rows) and 20 trials (20 columns) for bot exponential and power law. Since we
know the mean, standard deviation value, then I created normal distribution to find the task completion time
on Trial1 for each participant. Later on, in the first if loop I created the power-law formula to find out the time
on other trials as well as the exponential law formula under it. In the second if loop, I created subplots of each
participant learning curve using power law. Then I have plotted the mean learning curve as well as the mean
learning curve with the learning curve of a random individual. Later on, I plotted the same individual’s learning
curve using power-law and exponential law. In the end, I have plotted the mean graphs of both exponential
and power law.
Figure 1: Code for Power law and
Figure 2: Learning curve of 20
exponential law
individuals
Figure 3: Mean learning curve Figure 4: Mean learning curve with random
individual’s learning curve
, Figure 5: Random individual’s learning Figure 6: Mean learning curve with mean
curve with random individual’s exponential exponential curve
curve for the same individual
Figure 7: Random individual’s exponential
curve with mean exponential curve
Heathcote et al. (2000) showed in their conducted experiment that when three-parameter function of both
power-law and exponential law were compared, exponential law showed better results in around 80% of the
cases. Also, they thought that parameter estimates from power law can be not related to underlying learning.
[1] Additionally, Anderson (2001) found out that averaging different kinds of curve shapes tend to give power-
like functions. [2] Furthermore, Myung et al. (2000) worked to find why averaged curves give a bitter fit for
power-law when compared with exponential law. [3] Moreover, Murre and Chessa (2011) showed in their
study that when there are more than a few participants, the power function fits better than the exponential. [4]
If we look at the variance and number of participant graph of power-law and exponential law, we can see that
exponential law works better for 4 or less than 4 participants.