2025 Pearson Edexcel Level 1/Level 2 GCSE (9–1) Statistics PAPER 2
Foundation Tier Combined Question Paper and Marking Scheme
Please check the examination details below before entering your candidate information
Candidate surname Other names
Centre Number Candidate Number
Pearson Edexcel Level 1/Level 2 GCSE (9–1)
Friday 13 June 2025
Afternoon (Time: 1 hour 30 minutes) Paper
reference 1ST0/2F
Statistics
PAPER 2
Foundation Tier
You must have: Total Marks
Ruler graduated in centimetres and millimetres, protractor,
pair of compasses, pen, HB pencil, eraser, scientific calculator.
Instructions
•• Use black ink or ball‑point pen.
Fill in the boxes at the top of this page with your name,
centre number and candidate number.
•• Answer all questions.
Answer the questions in the spaces provided
– there may be more space than you need.
•• Scientific calculators may be used.
You must show all your working out with your answer clearly identified
at the end of your solution.
Information
•• The total mark for this paper is 80.
The marks for each question are shown in brackets
– use this as a guide as to how much time to spend on each question.
Advice
• Read each question carefully before you start to answer it.
• Check
Try to answer every question.
• your answers if you have time at the end.
Turn over
P76386A
©2025 Pearson Education Ltd.
Y:1/1/1/1/1/1/
, Answer ALL questions.
Write your answers in the spaces provided.
DO NOT WRITE IN THIS AREA
You must write down all the stages in your working.
1 Below are 10 cards from a game.
(a) Complete this two‑way table.
Black White Total
DO NOT WRITE IN THIS AREA
Star 3 1 4
Circle ........................ ........................ ........................
Total ........................ ........................ ........................
(1)
One of the 10 cards is picked at random.
(b) Write down the probability that the card picked is a star.
DO NOT WRITE IN THIS AREA
......................................................
(1)
(Total for Question 1 is 2 marks)
2
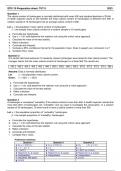
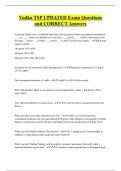
, 2 The table shows information about the percentage of teenagers who used different types
of devices in 2015 and in 2022
DO NOT WRITE IN THIS AREA
Device Smartphone Desktop/Laptop computer Gaming console
Year 2015 2022 2015 2022 2015 2022
Percentage (%) 73 95 87 90 81 80
(Source: www.pewresearch.org)
Sapna created a visual representation of these data.
73% 95% 87% 90% 81% 80%
DO NOT WRITE IN THIS AREA
Discuss whether or not Sapna’s visual representation was an appropriate way to
represent this information.
..................................................................................................................................................................................................................................................
..................................................................................................................................................................................................................................................
..................................................................................................................................................................................................................................................
..................................................................................................................................................................................................................................................
..................................................................................................................................................................................................................................................
..................................................................................................................................................................................................................................................
..................................................................................................................................................................................................................................................
(Total for Question 2 is 2 marks)
DO NOT WRITE IN THIS AREA
3
Turn over
, 3 The table shows information about the number of films that each of 12 students watched
during one week.
DO NOT WRITE IN THIS AREA
Number of films Frequency
1 2
2 6
3 3
4 1
(a) Work out the mean number of films watched per student.
DO NOT WRITE IN THIS AREA
......................................................
(2)
The mean number of films watched by twelve pensioners in the same week is 1.5
Alina claims that the students watched more television in this week than the pensioners.
(b) Explain why Alina’s claim may be incorrect.
..................................................................................................................................................................................................................................................
..................................................................................................................................................................................................................................................
..................................................................................................................................................................................................................................................
DO NOT WRITE IN THIS AREA
(1)
(Total for Question 3 is 3 marks)
4
Foundation Tier Combined Question Paper and Marking Scheme
Please check the examination details below before entering your candidate information
Candidate surname Other names
Centre Number Candidate Number
Pearson Edexcel Level 1/Level 2 GCSE (9–1)
Friday 13 June 2025
Afternoon (Time: 1 hour 30 minutes) Paper
reference 1ST0/2F
Statistics
PAPER 2
Foundation Tier
You must have: Total Marks
Ruler graduated in centimetres and millimetres, protractor,
pair of compasses, pen, HB pencil, eraser, scientific calculator.
Instructions
•• Use black ink or ball‑point pen.
Fill in the boxes at the top of this page with your name,
centre number and candidate number.
•• Answer all questions.
Answer the questions in the spaces provided
– there may be more space than you need.
•• Scientific calculators may be used.
You must show all your working out with your answer clearly identified
at the end of your solution.
Information
•• The total mark for this paper is 80.
The marks for each question are shown in brackets
– use this as a guide as to how much time to spend on each question.
Advice
• Read each question carefully before you start to answer it.
• Check
Try to answer every question.
• your answers if you have time at the end.
Turn over
P76386A
©2025 Pearson Education Ltd.
Y:1/1/1/1/1/1/
, Answer ALL questions.
Write your answers in the spaces provided.
DO NOT WRITE IN THIS AREA
You must write down all the stages in your working.
1 Below are 10 cards from a game.
(a) Complete this two‑way table.
Black White Total
DO NOT WRITE IN THIS AREA
Star 3 1 4
Circle ........................ ........................ ........................
Total ........................ ........................ ........................
(1)
One of the 10 cards is picked at random.
(b) Write down the probability that the card picked is a star.
DO NOT WRITE IN THIS AREA
......................................................
(1)
(Total for Question 1 is 2 marks)
2
, 2 The table shows information about the percentage of teenagers who used different types
of devices in 2015 and in 2022
DO NOT WRITE IN THIS AREA
Device Smartphone Desktop/Laptop computer Gaming console
Year 2015 2022 2015 2022 2015 2022
Percentage (%) 73 95 87 90 81 80
(Source: www.pewresearch.org)
Sapna created a visual representation of these data.
73% 95% 87% 90% 81% 80%
DO NOT WRITE IN THIS AREA
Discuss whether or not Sapna’s visual representation was an appropriate way to
represent this information.
..................................................................................................................................................................................................................................................
..................................................................................................................................................................................................................................................
..................................................................................................................................................................................................................................................
..................................................................................................................................................................................................................................................
..................................................................................................................................................................................................................................................
..................................................................................................................................................................................................................................................
..................................................................................................................................................................................................................................................
(Total for Question 2 is 2 marks)
DO NOT WRITE IN THIS AREA
3
Turn over
, 3 The table shows information about the number of films that each of 12 students watched
during one week.
DO NOT WRITE IN THIS AREA
Number of films Frequency
1 2
2 6
3 3
4 1
(a) Work out the mean number of films watched per student.
DO NOT WRITE IN THIS AREA
......................................................
(2)
The mean number of films watched by twelve pensioners in the same week is 1.5
Alina claims that the students watched more television in this week than the pensioners.
(b) Explain why Alina’s claim may be incorrect.
..................................................................................................................................................................................................................................................
..................................................................................................................................................................................................................................................
..................................................................................................................................................................................................................................................
DO NOT WRITE IN THIS AREA
(1)
(Total for Question 3 is 3 marks)
4