Biosystems Data Analysis
Table of Content
Week 3 ............................................................................................................................................................. 2
E ................................................................................................................................................................... 2
Lecture 5 ANOVA-Simultaneous Component Analysis – ASCA ......................................................... 2
ASCA – Smilde et.al................................................................................................................................... 5
R practical ................................................................................................................................................. 6
F.................................................................................................................................................................... 9
Lecture 6 Statistical Validation and Biomarker Selection ................................................................. 9
Smit ACA 2007 – paper ........................................................................................................................... 15
PLSDA cross validation – Johan et.al....................................................................................................... 15
R practical ............................................................................................................................................... 16
G ................................................................................................................................................................. 20
Lecture 7 Metabolic Network Inference ......................................................................................... 20
R practical ............................................................................................................................................... 24
Week 3 ........................................................................................................................................................... 26
H ................................................................................................................................................................. 26
Lecture 8 Microbiome data analysis ............................................................................................... 26
Normalizing Microbiome Data – McKnight et.al..................................................................................... 32
R practical ............................................................................................................................................... 33
1
,Week 3
E
In omics research it is increasingly common to analyse designed data. Those are data obtained when an
experimental design is underlying the study, such as treatment groups and/or time. This generates a certain
structure in the data and visualizing and investigating such data with PCA is no longer optimal. ASCA is the
preferred method and this will be explained starting with ordinary analysis-of-variance (ANOVA). Please
study the first ASCA publication Smilde2005.pdf which will also be used in the lecture.
Web lecture link: https://webcolleges.uva.nl/Mediasite/Play/cd48b0872da64a64ae869f681a7b99231d
Lecture 5 ANOVA-Simultaneous Component Analysis – ASCA
ANOVA: Analysis of Variance
Idea: is the difference between m1, m2 and mNO large enough
relative to within spread?
Goal: separate between sources of variation.
Use of ANOVA:
- To look for differences between groups
- To test the effect of a treatment
Assumptions of ANOVA:
- Replicates in a group are normally distributed. Or a log transform.
- The variance within groups are equal. Within a group/cell the variability across replicates is the
same.
One-way ANOVA notation: yik
Factor with levels (groups) I = 1, …, I the thing you change, it has different levels .
Replicates k = 1, …, K
The number of replicates is the same within groups (balanced designs).
𝒚𝒊𝒌 = 𝝁 + 𝜶𝒊 + 𝜺𝒊𝒌 ; 𝜺𝒊𝒌 ~𝑵(𝟎, 𝝈𝟐 ) 𝝁 = overall mean 𝜶𝒊 = effect of factor (level i)
So your ‘measured plant’ with treatment i and replicate k is yik. Systematic variation: 𝝁 + 𝜶𝒊 .
Deviations are relative to 𝝁. Centered around 0, thus ∑𝛼𝑖 = 0
𝜺𝒊𝒌 : the residuals; everything you cannot explain with 𝜇 and 𝛼𝑖 . Un-systematic variation (~ random).
Estimate of the one-way ANOVA:
𝑦𝑖𝑘 = 𝑦.. + (𝑦𝑖. − 𝑦.. ) + (𝑦𝑖𝑘 − 𝑦𝑖. ) = mean + between + individual, within
∑𝐼𝑖=1 ∑𝐾
𝑘=1 𝑦𝑖𝑘
𝑦.. = (each . / dot instead of i, j or k means you take the average
𝐼𝐾
∑𝐾
𝑘=1 𝑦𝑖𝑘
𝑦𝑖. = of the according variable). Thus y.. = overall mean.
𝐾
Sum of squares (SS): ∑𝑖 ∑𝑘(𝑦𝑖𝑘 − 𝑦.. )2 = ∑𝑖 ∑𝑘(𝑦𝑖. − 𝑦.. )2 + ∑𝑖 ∑𝑘(𝑦𝑖𝑘 − 𝑖.. )2
∑𝑖 ∑𝑘(𝑦𝑖𝑘 − 𝑦.. )2 = 𝐾 ∑𝑖(𝑦𝑖. − 𝑦.. )2 + ∑𝑖 ∑𝑘(𝑦𝑖𝑘 − 𝑖.. )2
Total SS = between SS + within SS
The cross-product vanishes because of orthogonality of the design.
Two-way ANOVA:
Two treatments A and B
- Is there an overall treatment effect?
- Is there an effect of treatment A?
- Is there an effect of treatment B?
- Is there an interaction effect?
2
,The design of two-way ANOVA:
- Special case: equal sample size
- I different fixed treatments Aj (i = treatment 1)
- J different fixed treatments Bj (j = treatment 2)
- K replications of each combination (Aj, Bj)
- Total I * J * K items yijk i indicates rows; j indicates columns; k indicates replicates/individuals.
𝒚𝒊𝒋𝒌 = 𝝁 + 𝜶𝒊 + 𝜷𝒋 + (𝜶𝜷)𝒊𝒋 + 𝜺𝒊𝒋𝒌 ; 𝜺𝒊𝒋𝒌~𝑵(𝟎, 𝝈𝟐 ) → linear model
= mean + main effect factor A + main effect factor B + interaction factor (A,B) + individual residual.
Estimate:
𝑦𝑖𝑗𝑘 = 𝑦.. + (𝑦𝑖.. − 𝑦... ) + (𝑦.𝑗. − 𝑦… ) + (𝑦𝑖𝑗. − 𝑦𝑖.. − 𝑦.𝑗. − 𝑦… ) + (𝑦𝑖𝑗𝑘 − 𝑦𝑖𝑗. )
= ean + main effect factor A + main effect factor B + interaction factor (A, B) + individual residual
∑𝐼𝑖=1 ∑𝐽𝑗=1 ∑𝐾
𝑘=1 𝑦𝑖𝑗𝑘
𝑦… =
𝐼𝐽𝐾
∑𝐽𝑗=1 ∑𝐾
𝑘=1 𝑦𝑖𝑗𝑘
𝑦𝑖.. =
𝐽𝐾
∑𝐼𝑖=1 ∑𝐾𝑘=1 𝑦𝑖𝑗𝑘
𝑦.𝑗. =
𝐼𝐾
∑𝐾
𝑘=1 𝑦𝑖𝑗𝑘
𝑦𝑖𝑗. =
𝐾
Sum of squares similar to one-way ANOVA: 𝑆𝑆𝑇𝑜𝑡𝑎𝑙 = 𝑆𝑆𝑏𝑒𝑡𝑤𝑒𝑒𝑛𝐴 + 𝑆𝑆𝑏𝑒𝑡𝑤𝑒𝑒𝑛𝐵 + 𝑆𝑆𝐼𝑛𝑡 + 𝑆𝑆𝑤𝑖𝑡ℎ𝑖𝑛
Again cross-product vanishes because of orthogonality of the design. Linear additivity!
ASCA model:
𝑦𝑖𝑗𝑘𝑖𝑗 = 𝜇 + 𝛼𝑖 + 𝛽𝑗 + (𝛼𝛽)𝑖𝑗 + (𝛼𝛽𝛾)𝑖𝑗𝑘𝑖𝑗
i = time ∑𝑖 𝛼𝑖 = 0
j = treatment (light) ∑𝑗 𝛽𝑗 = 0
kij = individual (plant) ∑𝑖 ∑𝑗(𝛼𝛽)𝑖𝑗 = 0
yijkij = data ∑𝑘𝑖𝑗 (𝛼𝛽𝛾)𝑖𝑗𝑘𝑖𝑗 = 0
ASCA estimates:
𝑦𝑖𝑗𝑘𝑖𝑗 = 𝑦… + (𝑦𝑖.. + 𝑦… ) + (𝑦.𝑗. − 𝑦… ) + (𝑦𝑖𝑗. − 𝑦𝑖.. + 𝑦.𝑗. + 𝑦… ) + (𝑦𝑖𝑗𝑘𝑖𝑗 − 𝑦𝑖𝑗. )
Then for every variable (metabolite) l:
2 2 2
𝑌 = 𝑌𝑚 + 𝑌𝛼 + 𝑌𝛽 + 𝑌𝛼𝛽 + 𝑌𝛼𝛽𝛾 → ‖𝑌‖2 = ‖𝑌𝑚 ‖2 + ‖𝑌𝛼 ‖2 + ‖𝑌𝛽 ‖ + ‖𝑌𝛼𝛽 ‖ + ‖𝑌𝛼𝛽𝛾 ‖
Column spaces are orthogonal.
In a matrix: 𝑌 = 𝑌𝛼 + 𝑌𝛽 + 𝐸(= 𝑌 − 𝑌𝛼 − 𝑌𝛽 )
SCA part of ASCA: you do PCA and get the lower formula →
3
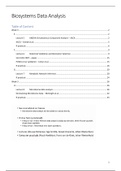
, Variability: back-projection.
Project effect matrix (Yk) + individual (E) onto corresponding Pk:
𝑍𝑘 = (𝑌𝑘 + 𝐸)𝑃𝑘 = 𝑇𝑘 + 𝐸𝑃𝑘 ; 𝑘 ∈ {𝛼, 𝛽, 𝛼𝛽}
Then plot rows of Zk: >>
Design Variation PCA
67 responses. And two factors, light and
time with different levels (light 4, time 7 levels).
Alternatives on the standard ASCA:
𝑦𝑖𝑗𝑘𝑖𝑗 = 𝜇 + 𝛼𝑖 + [𝛽𝑗 + (𝛼𝛽)𝑖𝑗 ] + (𝛼𝛽𝛾)𝑖𝑗𝑘
∑𝑖 𝛼𝑖 = 0 ∑𝑖 ∑𝑗 𝛽𝑗 + (𝛼𝛽)𝑖𝑗 = 0 ∑𝑘𝑖𝑗 (𝛼𝛽𝛾)𝑖𝑗𝑘𝑖𝑗 = 0
Open issues:
- statistical tests under construction
- unbalanced design
- random effects
- special designs (repeated measures, cross-over, split-plot)
You build an ANOVA per metabolite. Then for each metabolite you run the ANOVA model and take
estimates and put them next to each other, called bookkeeping. Then you run PCA on the separate
matrices related to treatments.
ASCA
Example exam question:
In a toxicological study, investigators want to test the toxicity of a compound in rats. The idea
is that the toxic compound will affect the metabolism of the rat depending on the dose of the
compound. After having administered a single dose at a certain point in time, the effect is
expected to become visual gradually in the urine metabolites of the rats which will be
measured by an instrumental method. You are asked to design this study for the investigator
and we want to analyze the resulting data with ASCA.
a) Which factors would you choose for the design and at which levels would you vary
those?
b) Would you include replicates in the design and if so, why?
variances within a group).
b) Yes, include replicates to check on assumptions of ANOVA (normality and equal
and a factor time at multiple levels (including a before dosage time point.)
a) Include different dosage regimes (at least four levels; none, low, medium and high)
Answers
4
Table of Content
Week 3 ............................................................................................................................................................. 2
E ................................................................................................................................................................... 2
Lecture 5 ANOVA-Simultaneous Component Analysis – ASCA ......................................................... 2
ASCA – Smilde et.al................................................................................................................................... 5
R practical ................................................................................................................................................. 6
F.................................................................................................................................................................... 9
Lecture 6 Statistical Validation and Biomarker Selection ................................................................. 9
Smit ACA 2007 – paper ........................................................................................................................... 15
PLSDA cross validation – Johan et.al....................................................................................................... 15
R practical ............................................................................................................................................... 16
G ................................................................................................................................................................. 20
Lecture 7 Metabolic Network Inference ......................................................................................... 20
R practical ............................................................................................................................................... 24
Week 3 ........................................................................................................................................................... 26
H ................................................................................................................................................................. 26
Lecture 8 Microbiome data analysis ............................................................................................... 26
Normalizing Microbiome Data – McKnight et.al..................................................................................... 32
R practical ............................................................................................................................................... 33
1
,Week 3
E
In omics research it is increasingly common to analyse designed data. Those are data obtained when an
experimental design is underlying the study, such as treatment groups and/or time. This generates a certain
structure in the data and visualizing and investigating such data with PCA is no longer optimal. ASCA is the
preferred method and this will be explained starting with ordinary analysis-of-variance (ANOVA). Please
study the first ASCA publication Smilde2005.pdf which will also be used in the lecture.
Web lecture link: https://webcolleges.uva.nl/Mediasite/Play/cd48b0872da64a64ae869f681a7b99231d
Lecture 5 ANOVA-Simultaneous Component Analysis – ASCA
ANOVA: Analysis of Variance
Idea: is the difference between m1, m2 and mNO large enough
relative to within spread?
Goal: separate between sources of variation.
Use of ANOVA:
- To look for differences between groups
- To test the effect of a treatment
Assumptions of ANOVA:
- Replicates in a group are normally distributed. Or a log transform.
- The variance within groups are equal. Within a group/cell the variability across replicates is the
same.
One-way ANOVA notation: yik
Factor with levels (groups) I = 1, …, I the thing you change, it has different levels .
Replicates k = 1, …, K
The number of replicates is the same within groups (balanced designs).
𝒚𝒊𝒌 = 𝝁 + 𝜶𝒊 + 𝜺𝒊𝒌 ; 𝜺𝒊𝒌 ~𝑵(𝟎, 𝝈𝟐 ) 𝝁 = overall mean 𝜶𝒊 = effect of factor (level i)
So your ‘measured plant’ with treatment i and replicate k is yik. Systematic variation: 𝝁 + 𝜶𝒊 .
Deviations are relative to 𝝁. Centered around 0, thus ∑𝛼𝑖 = 0
𝜺𝒊𝒌 : the residuals; everything you cannot explain with 𝜇 and 𝛼𝑖 . Un-systematic variation (~ random).
Estimate of the one-way ANOVA:
𝑦𝑖𝑘 = 𝑦.. + (𝑦𝑖. − 𝑦.. ) + (𝑦𝑖𝑘 − 𝑦𝑖. ) = mean + between + individual, within
∑𝐼𝑖=1 ∑𝐾
𝑘=1 𝑦𝑖𝑘
𝑦.. = (each . / dot instead of i, j or k means you take the average
𝐼𝐾
∑𝐾
𝑘=1 𝑦𝑖𝑘
𝑦𝑖. = of the according variable). Thus y.. = overall mean.
𝐾
Sum of squares (SS): ∑𝑖 ∑𝑘(𝑦𝑖𝑘 − 𝑦.. )2 = ∑𝑖 ∑𝑘(𝑦𝑖. − 𝑦.. )2 + ∑𝑖 ∑𝑘(𝑦𝑖𝑘 − 𝑖.. )2
∑𝑖 ∑𝑘(𝑦𝑖𝑘 − 𝑦.. )2 = 𝐾 ∑𝑖(𝑦𝑖. − 𝑦.. )2 + ∑𝑖 ∑𝑘(𝑦𝑖𝑘 − 𝑖.. )2
Total SS = between SS + within SS
The cross-product vanishes because of orthogonality of the design.
Two-way ANOVA:
Two treatments A and B
- Is there an overall treatment effect?
- Is there an effect of treatment A?
- Is there an effect of treatment B?
- Is there an interaction effect?
2
,The design of two-way ANOVA:
- Special case: equal sample size
- I different fixed treatments Aj (i = treatment 1)
- J different fixed treatments Bj (j = treatment 2)
- K replications of each combination (Aj, Bj)
- Total I * J * K items yijk i indicates rows; j indicates columns; k indicates replicates/individuals.
𝒚𝒊𝒋𝒌 = 𝝁 + 𝜶𝒊 + 𝜷𝒋 + (𝜶𝜷)𝒊𝒋 + 𝜺𝒊𝒋𝒌 ; 𝜺𝒊𝒋𝒌~𝑵(𝟎, 𝝈𝟐 ) → linear model
= mean + main effect factor A + main effect factor B + interaction factor (A,B) + individual residual.
Estimate:
𝑦𝑖𝑗𝑘 = 𝑦.. + (𝑦𝑖.. − 𝑦... ) + (𝑦.𝑗. − 𝑦… ) + (𝑦𝑖𝑗. − 𝑦𝑖.. − 𝑦.𝑗. − 𝑦… ) + (𝑦𝑖𝑗𝑘 − 𝑦𝑖𝑗. )
= ean + main effect factor A + main effect factor B + interaction factor (A, B) + individual residual
∑𝐼𝑖=1 ∑𝐽𝑗=1 ∑𝐾
𝑘=1 𝑦𝑖𝑗𝑘
𝑦… =
𝐼𝐽𝐾
∑𝐽𝑗=1 ∑𝐾
𝑘=1 𝑦𝑖𝑗𝑘
𝑦𝑖.. =
𝐽𝐾
∑𝐼𝑖=1 ∑𝐾𝑘=1 𝑦𝑖𝑗𝑘
𝑦.𝑗. =
𝐼𝐾
∑𝐾
𝑘=1 𝑦𝑖𝑗𝑘
𝑦𝑖𝑗. =
𝐾
Sum of squares similar to one-way ANOVA: 𝑆𝑆𝑇𝑜𝑡𝑎𝑙 = 𝑆𝑆𝑏𝑒𝑡𝑤𝑒𝑒𝑛𝐴 + 𝑆𝑆𝑏𝑒𝑡𝑤𝑒𝑒𝑛𝐵 + 𝑆𝑆𝐼𝑛𝑡 + 𝑆𝑆𝑤𝑖𝑡ℎ𝑖𝑛
Again cross-product vanishes because of orthogonality of the design. Linear additivity!
ASCA model:
𝑦𝑖𝑗𝑘𝑖𝑗 = 𝜇 + 𝛼𝑖 + 𝛽𝑗 + (𝛼𝛽)𝑖𝑗 + (𝛼𝛽𝛾)𝑖𝑗𝑘𝑖𝑗
i = time ∑𝑖 𝛼𝑖 = 0
j = treatment (light) ∑𝑗 𝛽𝑗 = 0
kij = individual (plant) ∑𝑖 ∑𝑗(𝛼𝛽)𝑖𝑗 = 0
yijkij = data ∑𝑘𝑖𝑗 (𝛼𝛽𝛾)𝑖𝑗𝑘𝑖𝑗 = 0
ASCA estimates:
𝑦𝑖𝑗𝑘𝑖𝑗 = 𝑦… + (𝑦𝑖.. + 𝑦… ) + (𝑦.𝑗. − 𝑦… ) + (𝑦𝑖𝑗. − 𝑦𝑖.. + 𝑦.𝑗. + 𝑦… ) + (𝑦𝑖𝑗𝑘𝑖𝑗 − 𝑦𝑖𝑗. )
Then for every variable (metabolite) l:
2 2 2
𝑌 = 𝑌𝑚 + 𝑌𝛼 + 𝑌𝛽 + 𝑌𝛼𝛽 + 𝑌𝛼𝛽𝛾 → ‖𝑌‖2 = ‖𝑌𝑚 ‖2 + ‖𝑌𝛼 ‖2 + ‖𝑌𝛽 ‖ + ‖𝑌𝛼𝛽 ‖ + ‖𝑌𝛼𝛽𝛾 ‖
Column spaces are orthogonal.
In a matrix: 𝑌 = 𝑌𝛼 + 𝑌𝛽 + 𝐸(= 𝑌 − 𝑌𝛼 − 𝑌𝛽 )
SCA part of ASCA: you do PCA and get the lower formula →
3
, Variability: back-projection.
Project effect matrix (Yk) + individual (E) onto corresponding Pk:
𝑍𝑘 = (𝑌𝑘 + 𝐸)𝑃𝑘 = 𝑇𝑘 + 𝐸𝑃𝑘 ; 𝑘 ∈ {𝛼, 𝛽, 𝛼𝛽}
Then plot rows of Zk: >>
Design Variation PCA
67 responses. And two factors, light and
time with different levels (light 4, time 7 levels).
Alternatives on the standard ASCA:
𝑦𝑖𝑗𝑘𝑖𝑗 = 𝜇 + 𝛼𝑖 + [𝛽𝑗 + (𝛼𝛽)𝑖𝑗 ] + (𝛼𝛽𝛾)𝑖𝑗𝑘
∑𝑖 𝛼𝑖 = 0 ∑𝑖 ∑𝑗 𝛽𝑗 + (𝛼𝛽)𝑖𝑗 = 0 ∑𝑘𝑖𝑗 (𝛼𝛽𝛾)𝑖𝑗𝑘𝑖𝑗 = 0
Open issues:
- statistical tests under construction
- unbalanced design
- random effects
- special designs (repeated measures, cross-over, split-plot)
You build an ANOVA per metabolite. Then for each metabolite you run the ANOVA model and take
estimates and put them next to each other, called bookkeeping. Then you run PCA on the separate
matrices related to treatments.
ASCA
Example exam question:
In a toxicological study, investigators want to test the toxicity of a compound in rats. The idea
is that the toxic compound will affect the metabolism of the rat depending on the dose of the
compound. After having administered a single dose at a certain point in time, the effect is
expected to become visual gradually in the urine metabolites of the rats which will be
measured by an instrumental method. You are asked to design this study for the investigator
and we want to analyze the resulting data with ASCA.
a) Which factors would you choose for the design and at which levels would you vary
those?
b) Would you include replicates in the design and if so, why?
variances within a group).
b) Yes, include replicates to check on assumptions of ANOVA (normality and equal
and a factor time at multiple levels (including a before dosage time point.)
a) Include different dosage regimes (at least four levels; none, low, medium and high)
Answers
4