USAF Greenbelt Questions
What are the three basic rules of Cause and Effect?
A 1) Everything happens for a reason, 2) Cause and effect are part of a continuous chain, 3) An effect can be due to
both a cause and a condition.
B 1) Brainstorm ideas and solutions, 2) Record the output, 3) Share the information with the Stakeholders to gain
their concurrence.
C 1) Display the many potential causes for a specific problem or effect, 2) Immediately sort the ideas into useful
categories, 3) Weight the ideas by team consensus.
D 1) Use it to study a problem to determine the root cause, 2) Examine the potential reasons why a process is having
problems, 3) Fix them.
A
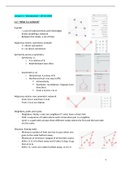
Which of the highlighted areas on this Cause and Effect Diagram is where one of the six major categories of causes
is listed?
A Area A
B Area B
C Area C
A
The Cause and Effect Diagram (often called a Fishbone Diagram) displays _____.
A a tool used to map the process
B a visual picture of a process that helps identify variations to target or where defects are occurring
C the many potential causes for a specific problem or effect and immediately sorts ideas into useful categories
D used to show the interrelationship of steps in a process
C
After establishing a team of Subject Matter Experts who have in-depth knowledge of the product and process, what
are the next three steps of a Root Cause Analysis process?
A 1) Measure the symptom to gauge the needed action, 2) Correct the cause by running a Kaizen Event, 3) Re-
measure the process to see if the problem has been eliminated.
B 1) Go to the Gemba, 2) Map the current state value stream, 3) Investigate the flow issues.
C 1) Identify and eliminate the cause of the variation, 2) Simplify the process so errors cannot occur, 3) Standardize
the activities such that all work will be performed in exactly the same manner.
D 1) Define the problem in terms of the observed effect, 2) Analyze why and when the problem happened, 3) Develop
a permanent solution to prevent the problem from reoccurring.
D
On a Cause and Effect Diagram, the effect or problem must be clearly stated before causes are listed.
A True
B False
A
A Cause and Effect Diagram is _____.
A a tool used to identify and organize potential root causes
B another name for a process map
C a diagram depicting the recommended improvement to a process
D not typically used for Six Sigma projects
A
,Which of the highlighted areas on this Cause and Effect diagram represents the "effect"?
A Area A
B Area B
C Area C
B
In a Cause and Effect Diagram, the terms Process, People, Measurement, Environment, Equipment, and Materials
are most often associated with which of the following?
A Categories of the effect
B Categories of major causes
C Assignable causes
D The head of the fish
B
Which hypothesis test is appropriate for comparing two sample means?
A 2-Proportion test
B ANOVA Two-Way
C Paired t-test
D 2-Sample t-test
D
A hypothesis test...
A is a requirement of every Six Sigma project.
B is run using only continuous data.
C is run using only discrete data.
D helps to determine if differences are statistically significant.
D
The "p" in p-value represents...
A proportion.
B percentage.
C predictability.
D probability.
D
If the p-value is less than or equal to 0.05...
A reject the null hypothesis; determine there is a statistically significant difference.
B rerun the hypothesis test.
C collects more data (increase the sample size).
D accepts the null hypothesis; there is no statistically significant difference.
A
The true test of significance is...
A null hypothesis test.
B the alternate hypothesis test.
C p-value.
,D Beta value.
C
Which of the following statements is NOT true regarding p-value?
A The result of every hypothesis test includes a p-value
B The p-value is the true test of significance
C The p-value represents the probability that the null hypothesis is TRUE
D If the p-value is less than or equal to 0.05, there is NOT a significant difference -- fail to reject the Null hypothesis
D
If we are working with discrete data and we want to compare three or more groups of data in categories, the
appropriate test is...
A ANOVA.
B 2-Sample t-test.
C 2-Proportion test.
D Chi-Square test.
D
If a statistical difference cannot be proven...
The team is done with the analysis.
B the practical difference should be considered.
C the Measure Phase must be repeated.
D no further action is required by the team.
B
When running a Test of Equal Variance for Normal data, which test statistic is read when you are comparing several
samples?
A F-test
B Bartlett's test
C Levene's test
D Standard deviation
B
In a Failure Mode and Effects Analysis, what does the SEV (Severity) rating indicate?
A The likelihood of the failure mode occurring
B The likelihood that the current control system will detect the cause or failure mode when it occurs
C How significant the impact of a failure will be to the customer
D How long the failure will last
C
Which one of the following uses a Risk Priority Number in assessing and prioritizing improvement efforts?
A Histogram
B Pareto Chart
C FMEA
D Cause and Effect Diagram
C
Is the following statement True or False? FMEA stands for failure mode and effects analysis.
A True
, B False
A
In a Failure Mode and Effects Analysis, what does the OCC (Occurrence) rating indicate?
A The likelihood of the failure occurring
B The likelihood that the current control system will detect the cause or failure mode when it occurs
C How significant the impact of a failure will be to the customer
D How long the failure will last
A
Which of the following activities does a Failure Mode and Effects Analysis involve?
A Calculating the actual probability of a failure for the given time period
B Predicting the expected number of failures in a given time period
C Predicting the time of first failure
D Studying how and what potentially could cause a product or process to fail
D
Which one of the following represents a more severe risk for a Risk Priority Number?
A A value of zero
B A negative value
C A higher value
D A lower value
C
Using error or mistake proofing within Failure Mode and Effects Analysis is the preferred method for...
A avoiding having to make a design change.
B improving detection techniques or equipment.
C adding inspection points in the process to monitor for the failure mode.
D changing the specifications to eliminate the defect.
B
In a Failure Mode and Effects Analysis, what does the DET (Detection) rating indicate?
A The likelihood of the failure occurring
B The likelihood that the current control system will detect the failure mode should it occur
C How significant the impact of a failure will be to the customer
D How long the failure will last
B
Which one of the following best describes a Risk Priority Number?
A The probability of failure
B The probability that the cause is related to the failure
C The relative ranking of the risks of failure
D The number of consecutive days since the last failure was reported
C
What is the Risk Priority Number (RPN) for sev=10, occ=5, and det=2?
A 52
B 100
What are the three basic rules of Cause and Effect?
A 1) Everything happens for a reason, 2) Cause and effect are part of a continuous chain, 3) An effect can be due to
both a cause and a condition.
B 1) Brainstorm ideas and solutions, 2) Record the output, 3) Share the information with the Stakeholders to gain
their concurrence.
C 1) Display the many potential causes for a specific problem or effect, 2) Immediately sort the ideas into useful
categories, 3) Weight the ideas by team consensus.
D 1) Use it to study a problem to determine the root cause, 2) Examine the potential reasons why a process is having
problems, 3) Fix them.
A
Which of the highlighted areas on this Cause and Effect Diagram is where one of the six major categories of causes
is listed?
A Area A
B Area B
C Area C
A
The Cause and Effect Diagram (often called a Fishbone Diagram) displays _____.
A a tool used to map the process
B a visual picture of a process that helps identify variations to target or where defects are occurring
C the many potential causes for a specific problem or effect and immediately sorts ideas into useful categories
D used to show the interrelationship of steps in a process
C
After establishing a team of Subject Matter Experts who have in-depth knowledge of the product and process, what
are the next three steps of a Root Cause Analysis process?
A 1) Measure the symptom to gauge the needed action, 2) Correct the cause by running a Kaizen Event, 3) Re-
measure the process to see if the problem has been eliminated.
B 1) Go to the Gemba, 2) Map the current state value stream, 3) Investigate the flow issues.
C 1) Identify and eliminate the cause of the variation, 2) Simplify the process so errors cannot occur, 3) Standardize
the activities such that all work will be performed in exactly the same manner.
D 1) Define the problem in terms of the observed effect, 2) Analyze why and when the problem happened, 3) Develop
a permanent solution to prevent the problem from reoccurring.
D
On a Cause and Effect Diagram, the effect or problem must be clearly stated before causes are listed.
A True
B False
A
A Cause and Effect Diagram is _____.
A a tool used to identify and organize potential root causes
B another name for a process map
C a diagram depicting the recommended improvement to a process
D not typically used for Six Sigma projects
A
,Which of the highlighted areas on this Cause and Effect diagram represents the "effect"?
A Area A
B Area B
C Area C
B
In a Cause and Effect Diagram, the terms Process, People, Measurement, Environment, Equipment, and Materials
are most often associated with which of the following?
A Categories of the effect
B Categories of major causes
C Assignable causes
D The head of the fish
B
Which hypothesis test is appropriate for comparing two sample means?
A 2-Proportion test
B ANOVA Two-Way
C Paired t-test
D 2-Sample t-test
D
A hypothesis test...
A is a requirement of every Six Sigma project.
B is run using only continuous data.
C is run using only discrete data.
D helps to determine if differences are statistically significant.
D
The "p" in p-value represents...
A proportion.
B percentage.
C predictability.
D probability.
D
If the p-value is less than or equal to 0.05...
A reject the null hypothesis; determine there is a statistically significant difference.
B rerun the hypothesis test.
C collects more data (increase the sample size).
D accepts the null hypothesis; there is no statistically significant difference.
A
The true test of significance is...
A null hypothesis test.
B the alternate hypothesis test.
C p-value.
,D Beta value.
C
Which of the following statements is NOT true regarding p-value?
A The result of every hypothesis test includes a p-value
B The p-value is the true test of significance
C The p-value represents the probability that the null hypothesis is TRUE
D If the p-value is less than or equal to 0.05, there is NOT a significant difference -- fail to reject the Null hypothesis
D
If we are working with discrete data and we want to compare three or more groups of data in categories, the
appropriate test is...
A ANOVA.
B 2-Sample t-test.
C 2-Proportion test.
D Chi-Square test.
D
If a statistical difference cannot be proven...
The team is done with the analysis.
B the practical difference should be considered.
C the Measure Phase must be repeated.
D no further action is required by the team.
B
When running a Test of Equal Variance for Normal data, which test statistic is read when you are comparing several
samples?
A F-test
B Bartlett's test
C Levene's test
D Standard deviation
B
In a Failure Mode and Effects Analysis, what does the SEV (Severity) rating indicate?
A The likelihood of the failure mode occurring
B The likelihood that the current control system will detect the cause or failure mode when it occurs
C How significant the impact of a failure will be to the customer
D How long the failure will last
C
Which one of the following uses a Risk Priority Number in assessing and prioritizing improvement efforts?
A Histogram
B Pareto Chart
C FMEA
D Cause and Effect Diagram
C
Is the following statement True or False? FMEA stands for failure mode and effects analysis.
A True
, B False
A
In a Failure Mode and Effects Analysis, what does the OCC (Occurrence) rating indicate?
A The likelihood of the failure occurring
B The likelihood that the current control system will detect the cause or failure mode when it occurs
C How significant the impact of a failure will be to the customer
D How long the failure will last
A
Which of the following activities does a Failure Mode and Effects Analysis involve?
A Calculating the actual probability of a failure for the given time period
B Predicting the expected number of failures in a given time period
C Predicting the time of first failure
D Studying how and what potentially could cause a product or process to fail
D
Which one of the following represents a more severe risk for a Risk Priority Number?
A A value of zero
B A negative value
C A higher value
D A lower value
C
Using error or mistake proofing within Failure Mode and Effects Analysis is the preferred method for...
A avoiding having to make a design change.
B improving detection techniques or equipment.
C adding inspection points in the process to monitor for the failure mode.
D changing the specifications to eliminate the defect.
B
In a Failure Mode and Effects Analysis, what does the DET (Detection) rating indicate?
A The likelihood of the failure occurring
B The likelihood that the current control system will detect the failure mode should it occur
C How significant the impact of a failure will be to the customer
D How long the failure will last
B
Which one of the following best describes a Risk Priority Number?
A The probability of failure
B The probability that the cause is related to the failure
C The relative ranking of the risks of failure
D The number of consecutive days since the last failure was reported
C
What is the Risk Priority Number (RPN) for sev=10, occ=5, and det=2?
A 52
B 100