PYC2606
Memorandum for
Assignment 02 Semester 1
2018
, Memorandum for Assignment 02 Semester 1 2018
Answer: Question:
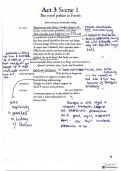
Question 1 Temba: I think there is a printing error in the manual. Figure 1 is
incomplete with no proper explanation provided. Do you
You agree most with, second most with know what this figure is about?
and least with:
Bets: Looking at the numbers I think the figure is a graphical
Option 5: representation of the information provided for Item 2.1
in Table 3
Fanie, Bets, Ben
Fanie: If your assumption is correct, Bets, the figure expresses
the item-total correlation for Item 2.1
Ben: No, I think the figure expresses the fact that five people
completed each item in the questionnaire
Question 2 Temba: So, what do the numbers on the X-axis mean?
You agree most with, second most with Fanie: I think the numbers on the X-axis represent the possible
and least with: responses to Item 2.1
Option 3: Bets: If the numbers on the X-axis represent the possible
responses to Item 2.1 it means five people completed
Ben, Fanie, Bets the item
Ben: If the X-axis represents Item 2.1 I would say it means the
numbers 1 to 5 are associated with the scale categories
that range from disagree strongly to agree strongly
Question 3 Temba: And those numbers in the square brackets, [1], [2], etc.
What do they stand for?
You agree most with, second most with
and least with: Fanie: The numbers in the square brackets are discrimination
values. They reflect the proportion of individuals who
Option 3: completed the item correctly
Ben, Bets, Fanie Bets: No, each point indicates the item score and the total
score of a particular individual
Ben: For example, [1] means that participant 1 obtained a
total score of 44 and also disagreed strongly with the
statement that drinking is relaxing
Question 4 You: Compare Item 2.9 as it is formulated in the questionnaire with
the item’s item-total correlation shown in Figure 2. Do you find this
You agree most with, second most with result surprising?
and least with:
Memorandum for
Assignment 02 Semester 1
2018
, Memorandum for Assignment 02 Semester 1 2018
Answer: Question:
Question 1 Temba: I think there is a printing error in the manual. Figure 1 is
incomplete with no proper explanation provided. Do you
You agree most with, second most with know what this figure is about?
and least with:
Bets: Looking at the numbers I think the figure is a graphical
Option 5: representation of the information provided for Item 2.1
in Table 3
Fanie, Bets, Ben
Fanie: If your assumption is correct, Bets, the figure expresses
the item-total correlation for Item 2.1
Ben: No, I think the figure expresses the fact that five people
completed each item in the questionnaire
Question 2 Temba: So, what do the numbers on the X-axis mean?
You agree most with, second most with Fanie: I think the numbers on the X-axis represent the possible
and least with: responses to Item 2.1
Option 3: Bets: If the numbers on the X-axis represent the possible
responses to Item 2.1 it means five people completed
Ben, Fanie, Bets the item
Ben: If the X-axis represents Item 2.1 I would say it means the
numbers 1 to 5 are associated with the scale categories
that range from disagree strongly to agree strongly
Question 3 Temba: And those numbers in the square brackets, [1], [2], etc.
What do they stand for?
You agree most with, second most with
and least with: Fanie: The numbers in the square brackets are discrimination
values. They reflect the proportion of individuals who
Option 3: completed the item correctly
Ben, Bets, Fanie Bets: No, each point indicates the item score and the total
score of a particular individual
Ben: For example, [1] means that participant 1 obtained a
total score of 44 and also disagreed strongly with the
statement that drinking is relaxing
Question 4 You: Compare Item 2.9 as it is formulated in the questionnaire with
the item’s item-total correlation shown in Figure 2. Do you find this
You agree most with, second most with result surprising?
and least with: