2025 Pearson Edexcel Level 3 GCE Statistics Advanced PAPER 1: Data and Probability Combined Question Paper & Final
Marking Scheme
Please check the examination details below before entering your candidate information
Candidate surname Other names
Centre Number Candidate Number
Pearson Edexcel Level 3 GCE
Thursday 5 June 2025
Morning (Time: 2 hours) Paper
reference 9ST0/01
Statistics
Advanced
PAPER 1: Data and Probability
You must have: Total Marks
Statistical formulae and tables booklet, Calculator
Candidates may use any calculator allowed by Pearson regulations.
Calculators must not have retrievable mathematical formulae stored in them.
Instructions
••• IfFillpencil
Use black ink or ball‑point pen.
is used for diagrams/sketches/graphs it must be dark (HB or B).
in the boxes at the top of this page with your name,
centre number and candidate number.
• clearly labelled.
Answer all questions and ensure that your answers to parts of questions are
• Answer the questions in the spaces provided
– there may be more space than you need.
• You should show sufficient working to make your methods clear.
Answers without working may not gain full credit.
• Unless otherwise stated, inexact answers should be given to three
significant figures.
• Unless otherwise stated, statistical tests should be carried out at the 5%
significance level.
Information
•• There
A booklet ‘Statistical formulae and tables’ is provided.
are 9 questions in this question paper. The total mark for this paper is 80.
• The
Advice
this asfora each
– usemarks question
guide as to howare shown
much timeintobrackets
spend on each question.
Read each question carefully before you start to answer it.
•• Try to answer every question.
•• If you change
Check your answers if you have time at the end.
your mind about an answer,
cross it out and put your new answer and any working underneath.
Turn over
P76381A
©2025 Pearson Education Ltd.
Y:1/1/1/1/1/1/1/1/
, Answer ALL questions. Write your answers in the spaces provided.
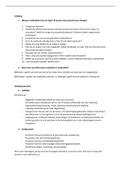
1 The stem and leaf diagram below shows the number of points scored by the
DO NOT WRITE IN THIS AREA
Los Angeles Lakers basketball team in the first 19 games of the 2019–2020 season.
9|5 represents
Points Totals
95 points
9 5 5 9 (3)
10 2 3 4 9 (4)
11 2 4 4 8 9 (5)
12 0 0 0 2 3 5 (6)
13 0 (1)
[Source: www.basketball‑reference.com]
(a) Find the median and the interquartile range for these data.
(3)
DO NOT WRITE IN THIS AREA
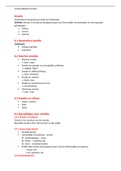
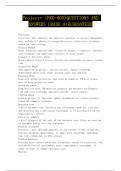
Figure 1 shows a box and whisker diagram containing information about the number
of points scored by the Los Angeles Lakers basketball team in the first 19 games of the
2020–2021 season.
90 95 100 105 110 115 120 125 130 135 140
Figure 1
[Source: www.basketball‑reference.com]
2
,
, Question 1 continued
(b) Compare the average and the spread of the points scored by the Los Angeles Lakers
DO NOT WRITE IN THIS AREA
in these two seasons.
(4)
DO NOT WRITE IN THIS AREA
(Total for Question 1 is 7 marks)
DO NOT WRITE IN THIS AREA
3
Turn over
Marking Scheme
Please check the examination details below before entering your candidate information
Candidate surname Other names
Centre Number Candidate Number
Pearson Edexcel Level 3 GCE
Thursday 5 June 2025
Morning (Time: 2 hours) Paper
reference 9ST0/01
Statistics
Advanced
PAPER 1: Data and Probability
You must have: Total Marks
Statistical formulae and tables booklet, Calculator
Candidates may use any calculator allowed by Pearson regulations.
Calculators must not have retrievable mathematical formulae stored in them.
Instructions
••• IfFillpencil
Use black ink or ball‑point pen.
is used for diagrams/sketches/graphs it must be dark (HB or B).
in the boxes at the top of this page with your name,
centre number and candidate number.
• clearly labelled.
Answer all questions and ensure that your answers to parts of questions are
• Answer the questions in the spaces provided
– there may be more space than you need.
• You should show sufficient working to make your methods clear.
Answers without working may not gain full credit.
• Unless otherwise stated, inexact answers should be given to three
significant figures.
• Unless otherwise stated, statistical tests should be carried out at the 5%
significance level.
Information
•• There
A booklet ‘Statistical formulae and tables’ is provided.
are 9 questions in this question paper. The total mark for this paper is 80.
• The
Advice
this asfora each
– usemarks question
guide as to howare shown
much timeintobrackets
spend on each question.
Read each question carefully before you start to answer it.
•• Try to answer every question.
•• If you change
Check your answers if you have time at the end.
your mind about an answer,
cross it out and put your new answer and any working underneath.
Turn over
P76381A
©2025 Pearson Education Ltd.
Y:1/1/1/1/1/1/1/1/
, Answer ALL questions. Write your answers in the spaces provided.
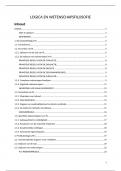
1 The stem and leaf diagram below shows the number of points scored by the
DO NOT WRITE IN THIS AREA
Los Angeles Lakers basketball team in the first 19 games of the 2019–2020 season.
9|5 represents
Points Totals
95 points
9 5 5 9 (3)
10 2 3 4 9 (4)
11 2 4 4 8 9 (5)
12 0 0 0 2 3 5 (6)
13 0 (1)
[Source: www.basketball‑reference.com]
(a) Find the median and the interquartile range for these data.
(3)
DO NOT WRITE IN THIS AREA
Figure 1 shows a box and whisker diagram containing information about the number
of points scored by the Los Angeles Lakers basketball team in the first 19 games of the
2020–2021 season.
90 95 100 105 110 115 120 125 130 135 140
Figure 1
[Source: www.basketball‑reference.com]
2
,
, Question 1 continued
(b) Compare the average and the spread of the points scored by the Los Angeles Lakers
DO NOT WRITE IN THIS AREA
in these two seasons.
(4)
DO NOT WRITE IN THIS AREA
(Total for Question 1 is 7 marks)
DO NOT WRITE IN THIS AREA
3
Turn over