APES Unit 4 progress check: mcq
Study online at https://quizlet.com/_aam5rm
1. Which of the following statements best describes the The map illustrates a trans-
boundary between the two tectonic plates seen in the form boundary, where tec-
map? tonic plates slide past
each other as the Pacific
Plate moves northwest and
the North American Plate
moves southeast.
2. The Atlantic Ocean is expanding as a result of plate A divergent plate bound-
tectonics. Which of the following explanations best ary exists at the Mid-At-
identifies the type of plate boundary and processes lantic Ridge where plates
occurring at the Mid-Atlantic Ridge, as shown in the move away from one an-
diagram below? other, leading to seafloor
spreading.
3. The map above shows the locations of known vol- The enclosed area shows a
canoes and earthquakes. Which of the following ex- hot spot in the middle of the
plains what is being illustrated in the enclosed area in Pacific Plate in the Hawaiian
the northwest portion of the map? Islands.
4. Which of the following would be most helpful to de- A density gradient tube and
termine the soil texture of a sample? a soil triangle
5. Students want to determine how vegetation affects Soil with no grass
soil erosion. They collect four soil samples of equal
starting mass with different types of vegetative cover,
as seen in the table below. Each sample is placed in a
three-sided plastic dish that can drain into a beaker
and is exposed to the same amount of consistent,
steady rainfall for ten minutes. The water and soil
runoff are collected in the beaker and separated. The
average values for each sample are provided below.
1/5
, APES Unit 4 progress check: mcq
Study online at https://quizlet.com/_aam5rm
Which of the following is the control group for this
experiment?
6. Students want to determine how vegetation affects Percent change in mass of
soil erosion. They collect four soil samples of equal the soil sample
starting mass with different types of vegetative cover,
as seen in the table below. Each sample is placed in a
three-sided plastic dish that can drain into a beaker
and is exposed to the same amount of consistent,
steady rainfall for ten minutes. The water and soil
runoff are collected in the beaker and separated.
The average values for each sample are provided be-
low.Which of the following is a dependent variable in
the experiment?
7. Which of the following describes the independent Soil samples taken from dif-
variable in this investigation? ferent locations
8. Which of the following describes the dependent vari- Percentage of each particle
able in this investigation? size in each soil sample
9. A student claims that soil sample B would be classified The student used a soil tri-
as a loam. Which of the following best describes the angle to determine where
method used by the student to reach this conclusion? the lines intersect for sand,
silt, and clay for the soil
sample.
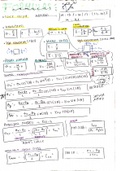
10. Which of the following abiotic factors, when graphed Temperature gradients
on the x-axis, leads to the curved line in the graph due
to variation in the different layers of the atmosphere?
11. Stratosphere
2/5
Study online at https://quizlet.com/_aam5rm
1. Which of the following statements best describes the The map illustrates a trans-
boundary between the two tectonic plates seen in the form boundary, where tec-
map? tonic plates slide past
each other as the Pacific
Plate moves northwest and
the North American Plate
moves southeast.
2. The Atlantic Ocean is expanding as a result of plate A divergent plate bound-
tectonics. Which of the following explanations best ary exists at the Mid-At-
identifies the type of plate boundary and processes lantic Ridge where plates
occurring at the Mid-Atlantic Ridge, as shown in the move away from one an-
diagram below? other, leading to seafloor
spreading.
3. The map above shows the locations of known vol- The enclosed area shows a
canoes and earthquakes. Which of the following ex- hot spot in the middle of the
plains what is being illustrated in the enclosed area in Pacific Plate in the Hawaiian
the northwest portion of the map? Islands.
4. Which of the following would be most helpful to de- A density gradient tube and
termine the soil texture of a sample? a soil triangle
5. Students want to determine how vegetation affects Soil with no grass
soil erosion. They collect four soil samples of equal
starting mass with different types of vegetative cover,
as seen in the table below. Each sample is placed in a
three-sided plastic dish that can drain into a beaker
and is exposed to the same amount of consistent,
steady rainfall for ten minutes. The water and soil
runoff are collected in the beaker and separated. The
average values for each sample are provided below.
1/5
, APES Unit 4 progress check: mcq
Study online at https://quizlet.com/_aam5rm
Which of the following is the control group for this
experiment?
6. Students want to determine how vegetation affects Percent change in mass of
soil erosion. They collect four soil samples of equal the soil sample
starting mass with different types of vegetative cover,
as seen in the table below. Each sample is placed in a
three-sided plastic dish that can drain into a beaker
and is exposed to the same amount of consistent,
steady rainfall for ten minutes. The water and soil
runoff are collected in the beaker and separated.
The average values for each sample are provided be-
low.Which of the following is a dependent variable in
the experiment?
7. Which of the following describes the independent Soil samples taken from dif-
variable in this investigation? ferent locations
8. Which of the following describes the dependent vari- Percentage of each particle
able in this investigation? size in each soil sample
9. A student claims that soil sample B would be classified The student used a soil tri-
as a loam. Which of the following best describes the angle to determine where
method used by the student to reach this conclusion? the lines intersect for sand,
silt, and clay for the soil
sample.
10. Which of the following abiotic factors, when graphed Temperature gradients
on the x-axis, leads to the curved line in the graph due
to variation in the different layers of the atmosphere?
11. Stratosphere
2/5