2025 OCR A Level Geology H414/03 Practical skills in geology Combined Question
Paper & Final Marking Scheme
Oxford Cambridge and RSA
Thursday 19 June 2025 – Morning
A Level Geology
H414/03 Practical skills in geology
Time allowed: 1 hour 30 minutes
*1883055674*
You must have:
• the Insert (inside this document)
You can use:
• an HB pencil
• a scientific or graphical calculator
• a protractor
• a ruler (cm/mm)
• A4 plain paper
* H 4 1 4 0 3 *
Please write clearly in black ink. Do not write in the barcodes.
Centre number Candidate number
First name(s)
Last name
INSTRUCTIONS
• Use black ink. You can use an HB pencil, but only for graphs and diagrams.
• Write your answer to each question in the space provided. If you need extra space use
the lined pages at the end of this booklet. The question numbers must be clearly shown.
• Answer all the questions.
• Where appropriate, your answer should be supported with working. Marks might be
given for using a correct method, even if your answer is wrong.
INFORMATION
• The total mark for this paper is 60.
• The marks for each question are shown in brackets [ ].
• Quality of extended response will be assessed in questions marked with an asterisk (*).
• This document has 16 pages.
ADVICE
• Read each question carefully before you start your answer.
© OCR 2025 [603/0782/1] OCR is an exempt Charity
DC (ST/FC) 350481/5 Turn over
, 2
1
(a) Fig. 1.1 in the Insert shows a thin section photograph of a carbonate rock.
(i) Name this rock using the Dunham classification scheme.
..........................................................................................................................................................
......................................................................................................................................................[1]
(ii) Calculate the magnification of the thin section photograph.
Magnification =............................................................ [2]
(iii) Describe the environment in which the carbonate rock in Fig. 1.1 in the Insert was deposited.
..........................................................................................................................................................
..........................................................................................................................................................
..........................................................................................................................................................
......................................................................................................................................................[2]
(iv) Explain how the carbonate rock in Fig. 1.1 in the Insert was formed.
..........................................................................................................................................................
..........................................................................................................................................................
..........................................................................................................................................................
......................................................................................................................................................[2]
(b) Fig. 1.2 in the Insert shows a hand specimen of a metamorphic rock.
(i) Estimate the ratio of dark to light minerals in the metamorphic rock.
dark minerals: light minerals = 1:............................................................ [1]
(ii) Explain what the texture of the rock in Fig. 1.2 suggests about the type and grade of
metamorphism the rock has undergone.
..........................................................................................................................................................
..........................................................................................................................................................
..........................................................................................................................................................
......................................................................................................................................................[2]
© OCR 2025
, 3
(c) * Use Fig. 1.3 in the Insert to compare the composition and texture (including crystal size)
of igneous rocks A and B.
..........................................................................................................................................................
..........................................................................................................................................................
..........................................................................................................................................................
..........................................................................................................................................................
..........................................................................................................................................................
..........................................................................................................................................................
..........................................................................................................................................................
..........................................................................................................................................................
..........................................................................................................................................................
..........................................................................................................................................................
..........................................................................................................................................................
..........................................................................................................................................................
..........................................................................................................................................................
..........................................................................................................................................................
...................................................................................................................................................... [6]
Extra answer space if required
..........................................................................................................................................................
..........................................................................................................................................................
..........................................................................................................................................................
..........................................................................................................................................................
..........................................................................................................................................................
© OCR 2025 Turn over
, 4
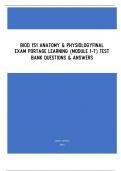
2 Some students visited a university to use a flume tank to investigate the formation of wave
ripples. The diagram shows a cross-sectional view of the flume tank.
direction of wave movement
clear side
paddle water level
at one
1 m end
creates water
waves depth
sand
ripple in sand
The students decided to investigate how water depth affects the wavelength of the wave ripples.
To do this the students:
• used a paddle at one end of the flume tank to generate waves which travelled through the
water and created wave ripples in the sand on the bottom of the flume tank.
• used well-sorted sand with a grain size of 0.2 mm.
• ensured that the surface of the sand was flattened before each experiment.
• ran the flume tank for 30 minutes for each of the four different water depths.
• measured the wavelength of eight wave ripples for each water depth using a ruler.
(a) The data collected by the students is shown in the table.
Water depth
60 cm 70 cm 80 cm 90 cm
10.0 19.5 32.5 42.5
11.0 19.5 31.0 45.0
12.5 21.0 31.5 44.5
11.0 20.5 30.0 47.0
Wavelength (cm)
11.5 18.5 33.5 46.5
12.0 22.0 29.5 45.0
13.0 19.5 32.0 46.0
12.5 20.0 30.5 44.5
Mean wavelength (cm) 11.69 20.06 31.31 45.13
Mean wavelength (cm)
11.7 20.1 31.3
to 3 significant figures ..................
Median wavelength
11.75 19.75 31.25
(cm) ..................
© OCR 2025
Paper & Final Marking Scheme
Oxford Cambridge and RSA
Thursday 19 June 2025 – Morning
A Level Geology
H414/03 Practical skills in geology
Time allowed: 1 hour 30 minutes
*1883055674*
You must have:
• the Insert (inside this document)
You can use:
• an HB pencil
• a scientific or graphical calculator
• a protractor
• a ruler (cm/mm)
• A4 plain paper
* H 4 1 4 0 3 *
Please write clearly in black ink. Do not write in the barcodes.
Centre number Candidate number
First name(s)
Last name
INSTRUCTIONS
• Use black ink. You can use an HB pencil, but only for graphs and diagrams.
• Write your answer to each question in the space provided. If you need extra space use
the lined pages at the end of this booklet. The question numbers must be clearly shown.
• Answer all the questions.
• Where appropriate, your answer should be supported with working. Marks might be
given for using a correct method, even if your answer is wrong.
INFORMATION
• The total mark for this paper is 60.
• The marks for each question are shown in brackets [ ].
• Quality of extended response will be assessed in questions marked with an asterisk (*).
• This document has 16 pages.
ADVICE
• Read each question carefully before you start your answer.
© OCR 2025 [603/0782/1] OCR is an exempt Charity
DC (ST/FC) 350481/5 Turn over
, 2
1
(a) Fig. 1.1 in the Insert shows a thin section photograph of a carbonate rock.
(i) Name this rock using the Dunham classification scheme.
..........................................................................................................................................................
......................................................................................................................................................[1]
(ii) Calculate the magnification of the thin section photograph.
Magnification =............................................................ [2]
(iii) Describe the environment in which the carbonate rock in Fig. 1.1 in the Insert was deposited.
..........................................................................................................................................................
..........................................................................................................................................................
..........................................................................................................................................................
......................................................................................................................................................[2]
(iv) Explain how the carbonate rock in Fig. 1.1 in the Insert was formed.
..........................................................................................................................................................
..........................................................................................................................................................
..........................................................................................................................................................
......................................................................................................................................................[2]
(b) Fig. 1.2 in the Insert shows a hand specimen of a metamorphic rock.
(i) Estimate the ratio of dark to light minerals in the metamorphic rock.
dark minerals: light minerals = 1:............................................................ [1]
(ii) Explain what the texture of the rock in Fig. 1.2 suggests about the type and grade of
metamorphism the rock has undergone.
..........................................................................................................................................................
..........................................................................................................................................................
..........................................................................................................................................................
......................................................................................................................................................[2]
© OCR 2025
, 3
(c) * Use Fig. 1.3 in the Insert to compare the composition and texture (including crystal size)
of igneous rocks A and B.
..........................................................................................................................................................
..........................................................................................................................................................
..........................................................................................................................................................
..........................................................................................................................................................
..........................................................................................................................................................
..........................................................................................................................................................
..........................................................................................................................................................
..........................................................................................................................................................
..........................................................................................................................................................
..........................................................................................................................................................
..........................................................................................................................................................
..........................................................................................................................................................
..........................................................................................................................................................
..........................................................................................................................................................
...................................................................................................................................................... [6]
Extra answer space if required
..........................................................................................................................................................
..........................................................................................................................................................
..........................................................................................................................................................
..........................................................................................................................................................
..........................................................................................................................................................
© OCR 2025 Turn over
, 4
2 Some students visited a university to use a flume tank to investigate the formation of wave
ripples. The diagram shows a cross-sectional view of the flume tank.
direction of wave movement
clear side
paddle water level
at one
1 m end
creates water
waves depth
sand
ripple in sand
The students decided to investigate how water depth affects the wavelength of the wave ripples.
To do this the students:
• used a paddle at one end of the flume tank to generate waves which travelled through the
water and created wave ripples in the sand on the bottom of the flume tank.
• used well-sorted sand with a grain size of 0.2 mm.
• ensured that the surface of the sand was flattened before each experiment.
• ran the flume tank for 30 minutes for each of the four different water depths.
• measured the wavelength of eight wave ripples for each water depth using a ruler.
(a) The data collected by the students is shown in the table.
Water depth
60 cm 70 cm 80 cm 90 cm
10.0 19.5 32.5 42.5
11.0 19.5 31.0 45.0
12.5 21.0 31.5 44.5
11.0 20.5 30.0 47.0
Wavelength (cm)
11.5 18.5 33.5 46.5
12.0 22.0 29.5 45.0
13.0 19.5 32.0 46.0
12.5 20.0 30.5 44.5
Mean wavelength (cm) 11.69 20.06 31.31 45.13
Mean wavelength (cm)
11.7 20.1 31.3
to 3 significant figures ..................
Median wavelength
11.75 19.75 31.25
(cm) ..................
© OCR 2025