UNIT 3 & 4 GEOGRAPHY
Key Geographic Features
• Change → phenomena are generally dynamic with change occurring at varying rates, at different times, over varying
durations & at different scales.
- Temporal change → time taken for change to occur
• Distance →
- absolute or linear (metres & kilometres)
- relative (length of time, costs involved, convenience of journey)
- psychological (perception of distance, familiarity = closer)
- cultural (sim/diff social norms & attitudes).
• Distribution → arrangement of phenomena in space or time.
- Spatial Distribution → how things are placed across Earth’s surface
• Environment → compromises living/non-living physical elements & social conditions of Earth’s surface & atmosphere.
- Natural Environment → weather & climate, landforms, water features, natural vegetation & soils.
- Human, Social & Cultural Environment → surroundings made by people or human-made influences like
settlements, transport routes & nodes, farmlands & social & political organisations.
• Interconnection → emphasises that no object of geographical study can be viewed in isolation.
- Phenomena can be Connected Through → environmental processes, the movement of people, flows of trade &
investment, the purchase of goods & services, cultural influences, the exchange of ideas & information, political
power & international agreements.
- Interconnections can be complex, reciprocal or interdependent & have strong influence on characteristics of
places.
• Movement → change or expansion in location of one or more phenomena from its original location to a new location.
- Considers Movements → nature, distance, direction, method, frequency, volume & magnitude. Flows showing
direction or quantity of movements can be mapped & analysed.
- Movement may involve flows of water, air, goods & people, or the transmission of ideas, energy & disease.
• Place → parts of the Earth’s surface that are identified & given meaning by people.
- Described by → location, shape, boundaries, features & environmental & human characteristics.
May be perceived, experienced, understood & valued differently
Range in size from a part of a room or garden to major world region
Some characteristics are tangible (eg. landforms & people) or intangible (eg. scenic quality & culture)
Places can be identified by their absolute or relative location
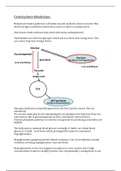
• Process → identifiable series of actions or steps leading to change or preservation of phenomena, or which assists in
developing an understanding of what creates, changes & sustains phenomena.
- Examples → erosion, atmospheric & ocean circulation, disease transmission, urban development & globalisation
Humans influence the rates & distribution of processes
• Region → definable area of the Earth’s surface that contains one or more common characteristics that distinguish it
from neighbouring areas.
- Regions are based on selected common characteristics & defined at different scales
Eg. intertidal region of coastal place, suburb like Frankston (local), Gippsland (within a state), Australian Alps
of Victoria & New South Wales (within country) or South-East Asia (extending over many countries).
• Scale → two related meanings; map scale & observational scale, used to analyse phenomena & find explanations for
different spatial levels.
- Map Scale → shows relationship between measurements on a map & actual measurements on the ground
- Observational Scale → relative size of phenomena to the size of the area being studied – local, regional, national,
international & global
- Scale may be perceived differently by diverse groups of people & organisations, being used to elevate or diminish
the significance of an issue.
, UNIT 3 & 4 GEOGRAPHY
• Spatial Association → degree to which two or more phenomena are similarly arranged over space.
- Spatial Association compares distribution patterns & interconnections between them.
- Strong Spatial Association occurs where the distribution of two phenomena are very similar.
- Weak Spatial Association means there is little similarity between the distribution of phenomena.
• Sustainability → capacity of the environment to continue to support life.
- Frames questions, evaluate findings of investigations, guide decisions & plan actions about environments,
places & communities
- Must study of environmental processes producing a degradation of environmental function, human actions
causing processes – demographic, social, economic & political causes of these human actions.
- Affected by Local Factors Including →
Climate
Altitude
Soil Type
Deforestation
• Deforestation → conversion of forest to another land use or the long-term reduction of the tree canopy cover below a
10-30% threshold. Deforestation implies the long-term or permanent loss of forest cover & its transformation into
another land use.
- Degradation → when deforestation results in more than 10-30% of forest cover remaining through processes like
selective logging or the development of secondary forest.
Estimated 18 million acres (7.3 million hectares) lost each year according to UN Food & Agriculture
Organization
Half of the world’s tropical forests have been cleared (UNFAO)
Forest loss contributes between 6% to 12% of annual global carbon dioxide emissions (Nature Geoscience)
36 football fields worth of trees are lost every minute (World Wildlife Fund)
Human activities have caused the deforestation of approx. 1.9 billion hectares
Around 13 million hectares of forest were converted to other uses of lost through natural causes each year
in the last decade compared to 16 million hectares a year in the 1990s
50% of tropical forests have been cleared
- Afforestation → the process of planting trees on land that was not previously forested.
- Reforestation → the process of replanting an area with trees.
Forests cover about 31% of land’s surface today (compared to 47% before introduction of agriculture)
Net change in forest area in 1990 to 2000 was -8.3 million hectares a year compared to 2000 & 2010 with
estimated -5.3 million hectares a year.
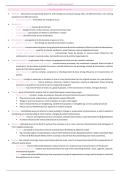
Last Glacial Maximum (LGM) → 20,000 years ago when Earth’s surface was
primarily extreme desert, with some forest near the equator.
Holocene Climatic Optimum (HCO) → 8,000 years ago when the Earth’s surface
was primarily forest, with some extreme desert in Central Asia & West Coast of
South America
Present → majority forest, with extreme desert in Northern & Central Africa, West
Coast of South America & Central Asia/parts of the Middle East.
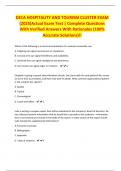
Forest Types →
• Forest → broadly describes an area that has a large number of trees. The type of forest is determined by climate.
- Temperate → found across eastern North America, Australia & Eurasia.
Temperatures vary throughout the year because of the four distinct seasons at these latitudes
Precipitation is abundant & lends to fertile soil that can support diverse flora like maples, oak & birch
Deer, squirrels & bears are just a few examples of the fauna that call temperate forests home
, UNIT 3 & 4 GEOGRAPHY
- Tropical → high biodiversity, common near the equator like Southeast Asia, sub-Saharan Africa & Central America
Temperatures in tropical forests have been reported to range between 20 & 31◦C
- Boreal (Taiga) → found across Siberia, Scandinavia & North America (Alaska & Canada)
Significant role in removing carbon dioxide from the atmosphere.
Temperatures on average are below freezing
Characteristics of Forests → categorized by the level of human activity involved in development
• Primary Forests → remain relatively undistributed & are still dominated by natural processes
• Secondary Forests → native species, recently disturbed by human activities, allowed to regenerate naturally or human
have intervened by replanting
• Plantations → monoculture of native & non-native trees planted for commercial or environmental services
Spatial Distribution →
• Forests cover 30% of the worlds land area
• Deforestation has resulted in 4.3 million hectares of forest lost, diminishing in extent & quality
Spatial Change of Forests →
• Last Glacial Maximum (20,000 years ago) →
- earth was colder & more arid, sea levels were at least 100m lower than present
- distribution during this time were less extensive
- grasslands, desert & tundra were more widely distributed
• Holocene Climatic Optimum (8,000 years ago) →
- sea levels rose
- warmer & wetter conditions prevailed
- forests expanded
Causes of Deforestation → main causes in last two centuries has been illegal logging & agriculture (human)
• Human Activities →
- Fire
- Clear-cutting for agriculture (ie. Palm oil & soy)
- Economic growth (74%)
- Cattle ranch
- Development
- Unsustainable logging for timber, paper (19%)
- Climate change
- Illegal logging (US$30-100 billion worth annually)
- Fuelwood harvesting (6%)
- Housing
- Urbanization
- War & civil disruption
• Natural Processes →
- Wildfire
- Droughts & floods (abiotic disturbances)
- Exotic animals
- Climate change & El Nino
- Storms
- Volcanic activity
- Insects, pests & diseases (biotic disturbances)
, UNIT 3 & 4 GEOGRAPHY
Impacts →
• Positive →
- Creates jobs (economic)
- Improves quality of life/living conditions (social)
- Creates more room for development/housing (social)
- Provides the supply for the demand (social)
• Negative →
- Destroy biodiversity of fauna & flora (environmental)
- Land degradation (environmental)
- Habitat loss for animals (environmental)
- Carbon dioxide released into atmosphere (environmental)
- Loss of potential medicines (social & economic)
- Breakdown of traditional way of life for Indigenous (social)
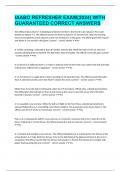
Borneo Case Study → Deforestation
Borneo → South-East Asia consisted of Brunei, Malaysia & Indonesia
Background →
• Region: Southeast Asia
• Location: Borneo is an island in South Pacific Ocean, located on equator between Southeast Asia & northern Australia,
part of Greater Sunda Islands in Malay Archipelago.
• Population: 2020, the population of Borneo was 23,053,723.
• Rainfall: between 2,000mm and 4,000mm of rainfall each year.
• Temperature: between 27°C and 32°C (80.6°F and 89.6°F).
• GDP/Capita: Malaysia is $11,648.67, Indonesia is $4,940.55, Borneo is $33,430.92.
• Topography: large, mountainous island with variety of landscapes, including rainforests, swamps, & montane forests.
• Type of Forest: tropical rainforests, peat swamps, mangroves, and montane forests.
• Common Characteristics of Tropical Forests: consistently high rainfall throughout year, closed canopy with emergent
trees reaching heights, extremely ↑ biodiversity with many endemic species, tropical climate with stable temps &
dominant presence of dipterocarp trees, creating a multi-layered forest structure with vines & epiphytes like orchids
& ferns.
Causes → largely subsistence & agro-industrial agriculture
• Subsistence Agriculture → slash & burn practices from local communities
- Requires low technology & usually done on rotation (or shifting) basis
- Most crops include rice, maize & vegetables
• Agro-Industrial Crops → rubber & other industrial tree plantations (~10% of entire Borneo Island)
- 65,000𝑘𝑘𝑘𝑘2 was planted with oil palm & 10,537𝑘𝑘𝑘𝑘2 under industrial tree plantations (mostly rubber trees or
acacias for the pulp & paper industry
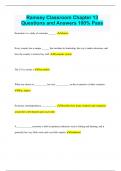
• Palm oil plantations are the leading cause of deforestation in Malaysia and Indonesia.
- 87% of Malaysia and 66% of Indonesia’s palm oil plantations are on deforested land.
- Palm oil is found in 50% of all packaged foods.
- Australians consume 10kgs/year
- Palm oil is in products like margarine, ice cream, biscuits, chocolate, cooking oil, toothpaste, soap and biofuel.
- Indonesian government has responded by setting a target to increase oil palm production from 20 million tonnes
in 2009 to 40 million tonnes in 2020.
• Other causes of deforestation linked to human development →
- Mining (coal, goal or other minerals)
- Infrastructure development (roads, human settlements etc.)
- Fires (cause extensive damage during El Nino-related drought events)
Key Geographic Features
• Change → phenomena are generally dynamic with change occurring at varying rates, at different times, over varying
durations & at different scales.
- Temporal change → time taken for change to occur
• Distance →
- absolute or linear (metres & kilometres)
- relative (length of time, costs involved, convenience of journey)
- psychological (perception of distance, familiarity = closer)
- cultural (sim/diff social norms & attitudes).
• Distribution → arrangement of phenomena in space or time.
- Spatial Distribution → how things are placed across Earth’s surface
• Environment → compromises living/non-living physical elements & social conditions of Earth’s surface & atmosphere.
- Natural Environment → weather & climate, landforms, water features, natural vegetation & soils.
- Human, Social & Cultural Environment → surroundings made by people or human-made influences like
settlements, transport routes & nodes, farmlands & social & political organisations.
• Interconnection → emphasises that no object of geographical study can be viewed in isolation.
- Phenomena can be Connected Through → environmental processes, the movement of people, flows of trade &
investment, the purchase of goods & services, cultural influences, the exchange of ideas & information, political
power & international agreements.
- Interconnections can be complex, reciprocal or interdependent & have strong influence on characteristics of
places.
• Movement → change or expansion in location of one or more phenomena from its original location to a new location.
- Considers Movements → nature, distance, direction, method, frequency, volume & magnitude. Flows showing
direction or quantity of movements can be mapped & analysed.
- Movement may involve flows of water, air, goods & people, or the transmission of ideas, energy & disease.
• Place → parts of the Earth’s surface that are identified & given meaning by people.
- Described by → location, shape, boundaries, features & environmental & human characteristics.
May be perceived, experienced, understood & valued differently
Range in size from a part of a room or garden to major world region
Some characteristics are tangible (eg. landforms & people) or intangible (eg. scenic quality & culture)
Places can be identified by their absolute or relative location
• Process → identifiable series of actions or steps leading to change or preservation of phenomena, or which assists in
developing an understanding of what creates, changes & sustains phenomena.
- Examples → erosion, atmospheric & ocean circulation, disease transmission, urban development & globalisation
Humans influence the rates & distribution of processes
• Region → definable area of the Earth’s surface that contains one or more common characteristics that distinguish it
from neighbouring areas.
- Regions are based on selected common characteristics & defined at different scales
Eg. intertidal region of coastal place, suburb like Frankston (local), Gippsland (within a state), Australian Alps
of Victoria & New South Wales (within country) or South-East Asia (extending over many countries).
• Scale → two related meanings; map scale & observational scale, used to analyse phenomena & find explanations for
different spatial levels.
- Map Scale → shows relationship between measurements on a map & actual measurements on the ground
- Observational Scale → relative size of phenomena to the size of the area being studied – local, regional, national,
international & global
- Scale may be perceived differently by diverse groups of people & organisations, being used to elevate or diminish
the significance of an issue.
, UNIT 3 & 4 GEOGRAPHY
• Spatial Association → degree to which two or more phenomena are similarly arranged over space.
- Spatial Association compares distribution patterns & interconnections between them.
- Strong Spatial Association occurs where the distribution of two phenomena are very similar.
- Weak Spatial Association means there is little similarity between the distribution of phenomena.
• Sustainability → capacity of the environment to continue to support life.
- Frames questions, evaluate findings of investigations, guide decisions & plan actions about environments,
places & communities
- Must study of environmental processes producing a degradation of environmental function, human actions
causing processes – demographic, social, economic & political causes of these human actions.
- Affected by Local Factors Including →
Climate
Altitude
Soil Type
Deforestation
• Deforestation → conversion of forest to another land use or the long-term reduction of the tree canopy cover below a
10-30% threshold. Deforestation implies the long-term or permanent loss of forest cover & its transformation into
another land use.
- Degradation → when deforestation results in more than 10-30% of forest cover remaining through processes like
selective logging or the development of secondary forest.
Estimated 18 million acres (7.3 million hectares) lost each year according to UN Food & Agriculture
Organization
Half of the world’s tropical forests have been cleared (UNFAO)
Forest loss contributes between 6% to 12% of annual global carbon dioxide emissions (Nature Geoscience)
36 football fields worth of trees are lost every minute (World Wildlife Fund)
Human activities have caused the deforestation of approx. 1.9 billion hectares
Around 13 million hectares of forest were converted to other uses of lost through natural causes each year
in the last decade compared to 16 million hectares a year in the 1990s
50% of tropical forests have been cleared
- Afforestation → the process of planting trees on land that was not previously forested.
- Reforestation → the process of replanting an area with trees.
Forests cover about 31% of land’s surface today (compared to 47% before introduction of agriculture)
Net change in forest area in 1990 to 2000 was -8.3 million hectares a year compared to 2000 & 2010 with
estimated -5.3 million hectares a year.
Last Glacial Maximum (LGM) → 20,000 years ago when Earth’s surface was
primarily extreme desert, with some forest near the equator.
Holocene Climatic Optimum (HCO) → 8,000 years ago when the Earth’s surface
was primarily forest, with some extreme desert in Central Asia & West Coast of
South America
Present → majority forest, with extreme desert in Northern & Central Africa, West
Coast of South America & Central Asia/parts of the Middle East.
Forest Types →
• Forest → broadly describes an area that has a large number of trees. The type of forest is determined by climate.
- Temperate → found across eastern North America, Australia & Eurasia.
Temperatures vary throughout the year because of the four distinct seasons at these latitudes
Precipitation is abundant & lends to fertile soil that can support diverse flora like maples, oak & birch
Deer, squirrels & bears are just a few examples of the fauna that call temperate forests home
, UNIT 3 & 4 GEOGRAPHY
- Tropical → high biodiversity, common near the equator like Southeast Asia, sub-Saharan Africa & Central America
Temperatures in tropical forests have been reported to range between 20 & 31◦C
- Boreal (Taiga) → found across Siberia, Scandinavia & North America (Alaska & Canada)
Significant role in removing carbon dioxide from the atmosphere.
Temperatures on average are below freezing
Characteristics of Forests → categorized by the level of human activity involved in development
• Primary Forests → remain relatively undistributed & are still dominated by natural processes
• Secondary Forests → native species, recently disturbed by human activities, allowed to regenerate naturally or human
have intervened by replanting
• Plantations → monoculture of native & non-native trees planted for commercial or environmental services
Spatial Distribution →
• Forests cover 30% of the worlds land area
• Deforestation has resulted in 4.3 million hectares of forest lost, diminishing in extent & quality
Spatial Change of Forests →
• Last Glacial Maximum (20,000 years ago) →
- earth was colder & more arid, sea levels were at least 100m lower than present
- distribution during this time were less extensive
- grasslands, desert & tundra were more widely distributed
• Holocene Climatic Optimum (8,000 years ago) →
- sea levels rose
- warmer & wetter conditions prevailed
- forests expanded
Causes of Deforestation → main causes in last two centuries has been illegal logging & agriculture (human)
• Human Activities →
- Fire
- Clear-cutting for agriculture (ie. Palm oil & soy)
- Economic growth (74%)
- Cattle ranch
- Development
- Unsustainable logging for timber, paper (19%)
- Climate change
- Illegal logging (US$30-100 billion worth annually)
- Fuelwood harvesting (6%)
- Housing
- Urbanization
- War & civil disruption
• Natural Processes →
- Wildfire
- Droughts & floods (abiotic disturbances)
- Exotic animals
- Climate change & El Nino
- Storms
- Volcanic activity
- Insects, pests & diseases (biotic disturbances)
, UNIT 3 & 4 GEOGRAPHY
Impacts →
• Positive →
- Creates jobs (economic)
- Improves quality of life/living conditions (social)
- Creates more room for development/housing (social)
- Provides the supply for the demand (social)
• Negative →
- Destroy biodiversity of fauna & flora (environmental)
- Land degradation (environmental)
- Habitat loss for animals (environmental)
- Carbon dioxide released into atmosphere (environmental)
- Loss of potential medicines (social & economic)
- Breakdown of traditional way of life for Indigenous (social)
Borneo Case Study → Deforestation
Borneo → South-East Asia consisted of Brunei, Malaysia & Indonesia
Background →
• Region: Southeast Asia
• Location: Borneo is an island in South Pacific Ocean, located on equator between Southeast Asia & northern Australia,
part of Greater Sunda Islands in Malay Archipelago.
• Population: 2020, the population of Borneo was 23,053,723.
• Rainfall: between 2,000mm and 4,000mm of rainfall each year.
• Temperature: between 27°C and 32°C (80.6°F and 89.6°F).
• GDP/Capita: Malaysia is $11,648.67, Indonesia is $4,940.55, Borneo is $33,430.92.
• Topography: large, mountainous island with variety of landscapes, including rainforests, swamps, & montane forests.
• Type of Forest: tropical rainforests, peat swamps, mangroves, and montane forests.
• Common Characteristics of Tropical Forests: consistently high rainfall throughout year, closed canopy with emergent
trees reaching heights, extremely ↑ biodiversity with many endemic species, tropical climate with stable temps &
dominant presence of dipterocarp trees, creating a multi-layered forest structure with vines & epiphytes like orchids
& ferns.
Causes → largely subsistence & agro-industrial agriculture
• Subsistence Agriculture → slash & burn practices from local communities
- Requires low technology & usually done on rotation (or shifting) basis
- Most crops include rice, maize & vegetables
• Agro-Industrial Crops → rubber & other industrial tree plantations (~10% of entire Borneo Island)
- 65,000𝑘𝑘𝑘𝑘2 was planted with oil palm & 10,537𝑘𝑘𝑘𝑘2 under industrial tree plantations (mostly rubber trees or
acacias for the pulp & paper industry
• Palm oil plantations are the leading cause of deforestation in Malaysia and Indonesia.
- 87% of Malaysia and 66% of Indonesia’s palm oil plantations are on deforested land.
- Palm oil is found in 50% of all packaged foods.
- Australians consume 10kgs/year
- Palm oil is in products like margarine, ice cream, biscuits, chocolate, cooking oil, toothpaste, soap and biofuel.
- Indonesian government has responded by setting a target to increase oil palm production from 20 million tonnes
in 2009 to 40 million tonnes in 2020.
• Other causes of deforestation linked to human development →
- Mining (coal, goal or other minerals)
- Infrastructure development (roads, human settlements etc.)
- Fires (cause extensive damage during El Nino-related drought events)