RM | Unit 140 - Multiple Linear Regression
Book: Analysing Data Using Linear Models
Chapter 4: 4.15, 4.16, 4.17
Chapter 4.15: Multiple regression in R
Check the book on how to do this in R.
Chapter 4.16: Multicollinearity
In general, if you add independent variables to a regression equation, the proportion explained variance,
R2, increases. Suppose you have the following three regression equations: weight = b0 + b1 × volume + e
(4.39) weight = b0 + b1 × area + e (4.40) weight = b0 + b1 × volume + b2 × area + e (4.41) 136 If we
carry out these three analyses, we obtain an R2 of 0.8026346 if we only use volume as predictor, and an
R2 of 0.1268163 if we only use area as predictor.
→ If we carry out these three analyses, we obtain an R2 of 0.8026346 if we only use volume
as a predictor, and an R2 of 0.1268163 if we only use the area as a predictor. So perhaps you’d think
that if we take both volume and area as predictors in the model, we
would get an R2 of 0.8026346+ 0.1268163 = 0.9294509. However,
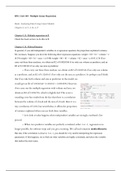
if we carry out the multiple regression with volume and area, we
obtain an R2 of 0.9284738, which is slightly less! This is not a
rounding error but results from the fact that there is a correlation
between the volume of a book and the area of a book. Here it is a
tiny correlation of 0.002, but nevertheless, it affects the proportion
of variance explained when you use both these variables.
→ Let’s look at what happens when independent variables are strongly correlated. (See
picture)
→ When two predictor variables are perfectly correlated, either 1 or -1, regression is no
longer possible, the software stops and you get a warning. We call such situation multicollinearity.
But also if the correlation is close to 1 or -1, you should be very careful interpreting the regression
parameters. If this happens, try to find out what variables are highly correlated, and select the variable
that makes the most sense.
Book: Analysing Data Using Linear Models
Chapter 4: 4.15, 4.16, 4.17
Chapter 4.15: Multiple regression in R
Check the book on how to do this in R.
Chapter 4.16: Multicollinearity
In general, if you add independent variables to a regression equation, the proportion explained variance,
R2, increases. Suppose you have the following three regression equations: weight = b0 + b1 × volume + e
(4.39) weight = b0 + b1 × area + e (4.40) weight = b0 + b1 × volume + b2 × area + e (4.41) 136 If we
carry out these three analyses, we obtain an R2 of 0.8026346 if we only use volume as predictor, and an
R2 of 0.1268163 if we only use area as predictor.
→ If we carry out these three analyses, we obtain an R2 of 0.8026346 if we only use volume
as a predictor, and an R2 of 0.1268163 if we only use the area as a predictor. So perhaps you’d think
that if we take both volume and area as predictors in the model, we
would get an R2 of 0.8026346+ 0.1268163 = 0.9294509. However,
if we carry out the multiple regression with volume and area, we
obtain an R2 of 0.9284738, which is slightly less! This is not a
rounding error but results from the fact that there is a correlation
between the volume of a book and the area of a book. Here it is a
tiny correlation of 0.002, but nevertheless, it affects the proportion
of variance explained when you use both these variables.
→ Let’s look at what happens when independent variables are strongly correlated. (See
picture)
→ When two predictor variables are perfectly correlated, either 1 or -1, regression is no
longer possible, the software stops and you get a warning. We call such situation multicollinearity.
But also if the correlation is close to 1 or -1, you should be very careful interpreting the regression
parameters. If this happens, try to find out what variables are highly correlated, and select the variable
that makes the most sense.