MATH 302 WEEK 6 TEST | QUESTIONS AND ANSWERS
| LATEST 2025/2026 UPDATE | 100% CORRECT -
AMERICAN MILITARY UNIVERSITY
Written June 28, 2025 8:25 PM - June 28, 2025 9:47 PM
Attempt Score - 95 %
Overall Grade (Highest Attempt) - 95 %
point
Question 1
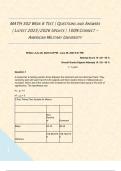
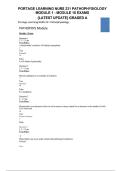
A researcher is testing reaction times between the dominant and non-dominant hand. They
randomly start with each hand for 20 subjects and their reaction times in milliseconds are
recorded. Test to see if the reaction time is faster for the dominant hand using a 5% level of
significance. The hypotheses are:
H0 : μD = 0
H1 : μD > 0
t-Test: Paired Two Sample for Means
Non-
Domina
nt Dominant
Mean 63.33 56.28
218.964315 128.752210
8 5
Variance
1
, Observations 20 20
Pearson Correlation 0.9067
Hypothesized Mean Difference 0
df 19
t Stat 4.7951
P(T<=t) one-tail 0.0001
t Critical one-tail 1.7291
P(T<=t) two-tail 0.0001
t Critical two-tail 2.0930
What is the correct test statistic?
0.9067
0.0001
1.7291
4.7951
2.0930
Hide question 1 feedback
The Test stat is 4.7951. This is given to you in the output. No calculations are needed.
The Test stat is 4.7951. This is given to you in the output. No calculations are needed.
2
,Q2 point
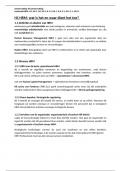
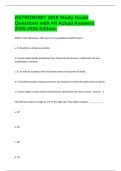
A manager wants to see if it worth going back for a MBA degree. They randomly sample 18
managers' salaries before and after undertaking a MBA degree and record their salaries in
thousands of dollars. Assume Salaries are normally distributed. Test the claim that the MBA
degree, on average, increases a manager's salary. Use a 10% level of significance.
t-Test: Paired Two Sample for Means
New Old
Salary Salary
Mean 61.878 56.999
Variance 177.5551 115.8012
Observations 18 18
Pearson Correlation 0.7464
Hypothesized Mean Difference 0
df 17
t Stat 2.9870
P(T<=t) one-tail 0.0024
t Critical one-tail 1.3334
P(T<=t) two-tail 0.0048
t Critical two-tail 1.7396
The hypotheses for this problem are:
H0: μD = 0
H1: μD > 0
What is the correct test statistic?
1.3334
3
| LATEST 2025/2026 UPDATE | 100% CORRECT -
AMERICAN MILITARY UNIVERSITY
Written June 28, 2025 8:25 PM - June 28, 2025 9:47 PM
Attempt Score - 95 %
Overall Grade (Highest Attempt) - 95 %
point
Question 1
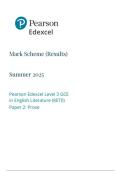
A researcher is testing reaction times between the dominant and non-dominant hand. They
randomly start with each hand for 20 subjects and their reaction times in milliseconds are
recorded. Test to see if the reaction time is faster for the dominant hand using a 5% level of
significance. The hypotheses are:
H0 : μD = 0
H1 : μD > 0
t-Test: Paired Two Sample for Means
Non-
Domina
nt Dominant
Mean 63.33 56.28
218.964315 128.752210
8 5
Variance
1
, Observations 20 20
Pearson Correlation 0.9067
Hypothesized Mean Difference 0
df 19
t Stat 4.7951
P(T<=t) one-tail 0.0001
t Critical one-tail 1.7291
P(T<=t) two-tail 0.0001
t Critical two-tail 2.0930
What is the correct test statistic?
0.9067
0.0001
1.7291
4.7951
2.0930
Hide question 1 feedback
The Test stat is 4.7951. This is given to you in the output. No calculations are needed.
The Test stat is 4.7951. This is given to you in the output. No calculations are needed.
2
,Q2 point
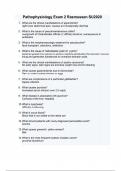
A manager wants to see if it worth going back for a MBA degree. They randomly sample 18
managers' salaries before and after undertaking a MBA degree and record their salaries in
thousands of dollars. Assume Salaries are normally distributed. Test the claim that the MBA
degree, on average, increases a manager's salary. Use a 10% level of significance.
t-Test: Paired Two Sample for Means
New Old
Salary Salary
Mean 61.878 56.999
Variance 177.5551 115.8012
Observations 18 18
Pearson Correlation 0.7464
Hypothesized Mean Difference 0
df 17
t Stat 2.9870
P(T<=t) one-tail 0.0024
t Critical one-tail 1.3334
P(T<=t) two-tail 0.0048
t Critical two-tail 1.7396
The hypotheses for this problem are:
H0: μD = 0
H1: μD > 0
What is the correct test statistic?
1.3334
3