6/28/25, 2:27 PM Week 8 Test
Attempt Score - 85 %
Overall Grade (Highest Attempt) - 85 %
Written June 28, 2025 8:25 PM - June 28, 2025 9:47 PM
Question 1 point
A college prep school advertises that their students are more prepared to succeed in college than other schools. To
verify this, they categorize GPA's into 4 groups and look up the proportion of students at a state college in each
category. They find that 7% have a 0-0.99, 21% have a 1-1.99, 37% have a 2-2.99, and 35% have a 3-4.00 in GPA.
They then take a random sample of 200 of their graduates at the state college and find that 19 has a 0-
0.99, 28 have a 1-1.99, 82 have a 2-2.99, and 71 have a 3-4.00.
Can they conclude that the grades of their graduates are distributed differently than the general population at the
school? Test at the 0.05 level of significance.
Enter the p-value - round to 4 decimal places. Make sure you put a 0 in front of the decimal.
p-value=___
Answer: 0.0621 (0.0620)
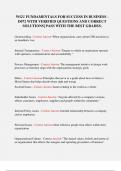
question 1 feedback
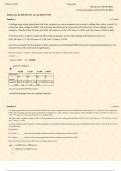
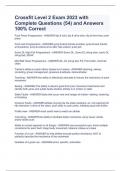
0-0.99 1-1.99 2-2.99 3-4.00
Observed
19 28 82 71
Counts
Expected =200*0.07=200*.21==200*.37=200*.35 Counts
=14 42 = 74 = 70
You can use Excel to find the p-value
=CHISQ.TEST(Highlight Observed, Highlight Expected)
Question 2 point
A college prep school advertises that their students are more prepared to succeed in college than other schools. To verify this, they categorize
GPA's into 4 groups and look up the proportion of students at a state college in each category. They find that 7% have a 0-0.99, 21% have a 1-
1.99, 37% have a 2-2.99, and 35% have a 3-4.00 in GPA.
They then take a random sample of 200 of their graduates at the state college and find that 19 has a 0-0.99, 28 have a 1-1.99, 82 have a 22.99,
and 71 have a 3-4.00.
Can they conclude that the grades of their graduates are distributed differently than the general population at the school? Test at the 0.05 level
of significance.
Hypotheses:
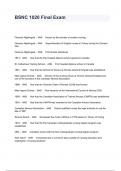
H0: There is ______ between the general population and the college prep students in GPA.
H1: There is ______ between the general population and the college prep students in GPA.
Select the best fit choices that fit in the two blank spaces above.
no difference, a difference a
difference, no difference no
, 6/28/25, 2:27 PM Week 8 Test
difference, no difference a
difference, a difference
Question 3 point
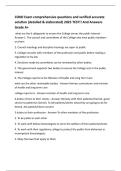
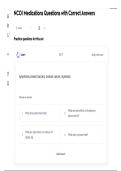
A large department store is curious about what sections of the store make the most sales. The manager has data
from ten years prior that show 30% of sales come from Clothing, 25% Home Appliances, 18% Housewares, 13%
Cosmetics, 12% Jewelry, and 2% Other.
In a random sample of 550 current sales, 188 came from Clothing, 153 Home Appliances, 83 Housewares, 54
Cosmetics, 61 Jewelry, and 11 Other. At α=0.10, can the manager conclude that the distribution of sales among the
departments has changed?
Enter the p-value - round to 4 decimal places. Make sure you put a 0 in front of the decimal. p-value=___
=CHISQ.TEST(Highlight Observed, Highlight Expected)
Question 4 point
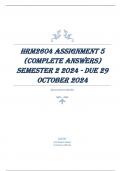
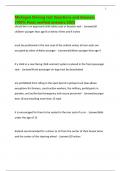
A company that develops over-the-counter medicines is working on a new product that is meant to shorten the length of sore throats. To test
their product for effectiveness, they take a random sample of 110 people and record how long it took for their symptoms to completely
disappear. The results are in the table below. The company knows that on average (without medication) it takes a sore throat 6 days or less to
heal 42% of the time, 7-9 days 31% of the time, 10-12 days 16% of the time, and 13 days or more 11% of the time. Can it be concluded at the
0.01 level of significance that the patients who took the medicine healed at a different rate than these percentages?
Enter the expected count for each category in the table below. Round to 1 decimal place.
6 days or less 7-9 days 10-12 days 13 or more days
Duration of Sore
Throat 49 40 12 9
Expected Counts ___ ___ ___ ___
Attempt Score - 85 %
Overall Grade (Highest Attempt) - 85 %
Written June 28, 2025 8:25 PM - June 28, 2025 9:47 PM
Question 1 point
A college prep school advertises that their students are more prepared to succeed in college than other schools. To
verify this, they categorize GPA's into 4 groups and look up the proportion of students at a state college in each
category. They find that 7% have a 0-0.99, 21% have a 1-1.99, 37% have a 2-2.99, and 35% have a 3-4.00 in GPA.
They then take a random sample of 200 of their graduates at the state college and find that 19 has a 0-
0.99, 28 have a 1-1.99, 82 have a 2-2.99, and 71 have a 3-4.00.
Can they conclude that the grades of their graduates are distributed differently than the general population at the
school? Test at the 0.05 level of significance.
Enter the p-value - round to 4 decimal places. Make sure you put a 0 in front of the decimal.
p-value=___
Answer: 0.0621 (0.0620)
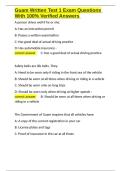
question 1 feedback
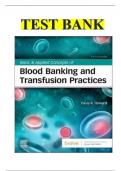
0-0.99 1-1.99 2-2.99 3-4.00
Observed
19 28 82 71
Counts
Expected =200*0.07=200*.21==200*.37=200*.35 Counts
=14 42 = 74 = 70
You can use Excel to find the p-value
=CHISQ.TEST(Highlight Observed, Highlight Expected)
Question 2 point
A college prep school advertises that their students are more prepared to succeed in college than other schools. To verify this, they categorize
GPA's into 4 groups and look up the proportion of students at a state college in each category. They find that 7% have a 0-0.99, 21% have a 1-
1.99, 37% have a 2-2.99, and 35% have a 3-4.00 in GPA.
They then take a random sample of 200 of their graduates at the state college and find that 19 has a 0-0.99, 28 have a 1-1.99, 82 have a 22.99,
and 71 have a 3-4.00.
Can they conclude that the grades of their graduates are distributed differently than the general population at the school? Test at the 0.05 level
of significance.
Hypotheses:
H0: There is ______ between the general population and the college prep students in GPA.
H1: There is ______ between the general population and the college prep students in GPA.
Select the best fit choices that fit in the two blank spaces above.
no difference, a difference a
difference, no difference no
, 6/28/25, 2:27 PM Week 8 Test
difference, no difference a
difference, a difference
Question 3 point
A large department store is curious about what sections of the store make the most sales. The manager has data
from ten years prior that show 30% of sales come from Clothing, 25% Home Appliances, 18% Housewares, 13%
Cosmetics, 12% Jewelry, and 2% Other.
In a random sample of 550 current sales, 188 came from Clothing, 153 Home Appliances, 83 Housewares, 54
Cosmetics, 61 Jewelry, and 11 Other. At α=0.10, can the manager conclude that the distribution of sales among the
departments has changed?
Enter the p-value - round to 4 decimal places. Make sure you put a 0 in front of the decimal. p-value=___
=CHISQ.TEST(Highlight Observed, Highlight Expected)
Question 4 point
A company that develops over-the-counter medicines is working on a new product that is meant to shorten the length of sore throats. To test
their product for effectiveness, they take a random sample of 110 people and record how long it took for their symptoms to completely
disappear. The results are in the table below. The company knows that on average (without medication) it takes a sore throat 6 days or less to
heal 42% of the time, 7-9 days 31% of the time, 10-12 days 16% of the time, and 13 days or more 11% of the time. Can it be concluded at the
0.01 level of significance that the patients who took the medicine healed at a different rate than these percentages?
Enter the expected count for each category in the table below. Round to 1 decimal place.
6 days or less 7-9 days 10-12 days 13 or more days
Duration of Sore
Throat 49 40 12 9
Expected Counts ___ ___ ___ ___