N2. Multiple regression was performed with network satisfaction as dependent variable and four social
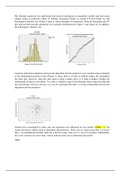
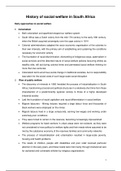
support scales as predictors (Table 4). Initially, histogram (Figure 3), normal P-P plot (Figure 4), and
Kolmogorov-Smirnov test (Table 2) used to check normality of distribution. Both the histogram and P-P
plot showed that network satisfaction was normally distributed (see Figure 3 and Figure 4). In addition,
the Kolmogorov-Smirnov test
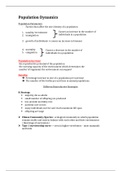
Linearity and heteroscedasticity between the dependent and the predictors were checked using scatterplot
of the standardized predicted value (Figure 5). Since there is no horn or diabolo shapes, the assumption
has been met. However, since the dots seem to form a slight curve, it is hard to deduce whether the
relationship is linear or non-linear. Yet, there is usually a sign of non-linearity when using real data and
the non-linearity itself not obvious, so it can be concluded that there is a linear relationship between the
dependent and the predictors.
Outliers also investigated to make sure the regression not influenced by any outliers (Table …). The
results showed no outliers both in dependent and predictors. There was no values more than 3 or lower
than -3 in standardized residual while the critical leverage value of 0.11 was not exceeded. Additionally,
the Cook’s distance far lower than 1 which indicates there are no influential data points.
Table .
, Statistics for outliers on the dependent variable (standardized residual), social support scales predictors
(leverage, critical value = 0.11), and influential data points (Cook’s distance) (N = 135)
Minimum Maximum
Standardized residual -2.62 2.26
Leverage value 0.00 0.16
Cook’s distance 0.00 0.09
The multiple regression analysis resulted in significant main effect F(4,130) = 7.13, p < 0.001. This
indicates there is relationship between the social support and network satisfaction. The predictors
explained 18% of the total variance in the sample (R2 = 0.180). Table … presents the result for the
individual factors. A significant result was found for instrumental scale, b = 0.55, t(130) = 2.91, p = 0.004.
This significance means when someone receiving more help through their networks, the network
satisfaction went up. The instrumental variable explained 5.3% of the total variance ( sr2 = 0.053). The
emotional scale also resulted in significant result, b = 1.33, t(130) = 3.22, p = 0.002, which indicates
when someone get more opportunities in express their feelings, the network satisfaction goes up. Of the
total variance, emotional variable contributed 6.6% (sr 2 = 0.066). The other variables did not give
significant result (Table …). When including all the predictors in regression equation, the unstandardized
equation would be as follows:
The predicted score of networking satisfaction = 11.34 + (0.08 informational) + (0.55 instrumental) +
(0.10 (Appraisal) + (1.33 emotional)
Table ….
Multiple regression analysis results for global support questions predictors (N = 132)
B SE β t p sr2
(Constant) 11.34 0.97 ─ 11.64 <0.001 ─
Global informational 0.08 0.29 0.03 0.26 0.799 0.04
Global instrumental 0.55 0.19 0.24 2.91 0.004 0.053
Global appraisal 0.10 0.31 0.03 0.33 0.740 0.001
Global emotional 1.33 0.30 0.30 3.22 0.002 0.066
To test the hypothesis of more global support questions lead to higher network satisfaction level, multiple
regression analysis was used (Table 4). First, the normal distribution assumption was checked through
histogram (Figure 3), normal P-P plot (Figure 4), and Kolmogorov-Smirnov test (Table 5). Through
Figure 3, it can be seen that the standardized residuals is normally distributed. Figure 4 concurs this, since
the points mainly on the straight line of the P-P plots. There were also nonsignificant residuals ( p =
0.091) as showed from Table 5.
support scales as predictors (Table 4). Initially, histogram (Figure 3), normal P-P plot (Figure 4), and
Kolmogorov-Smirnov test (Table 2) used to check normality of distribution. Both the histogram and P-P
plot showed that network satisfaction was normally distributed (see Figure 3 and Figure 4). In addition,
the Kolmogorov-Smirnov test
Linearity and heteroscedasticity between the dependent and the predictors were checked using scatterplot
of the standardized predicted value (Figure 5). Since there is no horn or diabolo shapes, the assumption
has been met. However, since the dots seem to form a slight curve, it is hard to deduce whether the
relationship is linear or non-linear. Yet, there is usually a sign of non-linearity when using real data and
the non-linearity itself not obvious, so it can be concluded that there is a linear relationship between the
dependent and the predictors.
Outliers also investigated to make sure the regression not influenced by any outliers (Table …). The
results showed no outliers both in dependent and predictors. There was no values more than 3 or lower
than -3 in standardized residual while the critical leverage value of 0.11 was not exceeded. Additionally,
the Cook’s distance far lower than 1 which indicates there are no influential data points.
Table .
, Statistics for outliers on the dependent variable (standardized residual), social support scales predictors
(leverage, critical value = 0.11), and influential data points (Cook’s distance) (N = 135)
Minimum Maximum
Standardized residual -2.62 2.26
Leverage value 0.00 0.16
Cook’s distance 0.00 0.09
The multiple regression analysis resulted in significant main effect F(4,130) = 7.13, p < 0.001. This
indicates there is relationship between the social support and network satisfaction. The predictors
explained 18% of the total variance in the sample (R2 = 0.180). Table … presents the result for the
individual factors. A significant result was found for instrumental scale, b = 0.55, t(130) = 2.91, p = 0.004.
This significance means when someone receiving more help through their networks, the network
satisfaction went up. The instrumental variable explained 5.3% of the total variance ( sr2 = 0.053). The
emotional scale also resulted in significant result, b = 1.33, t(130) = 3.22, p = 0.002, which indicates
when someone get more opportunities in express their feelings, the network satisfaction goes up. Of the
total variance, emotional variable contributed 6.6% (sr 2 = 0.066). The other variables did not give
significant result (Table …). When including all the predictors in regression equation, the unstandardized
equation would be as follows:
The predicted score of networking satisfaction = 11.34 + (0.08 informational) + (0.55 instrumental) +
(0.10 (Appraisal) + (1.33 emotional)
Table ….
Multiple regression analysis results for global support questions predictors (N = 132)
B SE β t p sr2
(Constant) 11.34 0.97 ─ 11.64 <0.001 ─
Global informational 0.08 0.29 0.03 0.26 0.799 0.04
Global instrumental 0.55 0.19 0.24 2.91 0.004 0.053
Global appraisal 0.10 0.31 0.03 0.33 0.740 0.001
Global emotional 1.33 0.30 0.30 3.22 0.002 0.066
To test the hypothesis of more global support questions lead to higher network satisfaction level, multiple
regression analysis was used (Table 4). First, the normal distribution assumption was checked through
histogram (Figure 3), normal P-P plot (Figure 4), and Kolmogorov-Smirnov test (Table 5). Through
Figure 3, it can be seen that the standardized residuals is normally distributed. Figure 4 concurs this, since
the points mainly on the straight line of the P-P plots. There were also nonsignificant residuals ( p =
0.091) as showed from Table 5.