statisticstheartandscienceoflearningfrom datainformation
statisticalproblemsolvingprocessformulatequestionscollectdataanalyzedatainterpretresults researchbroad statisticaldata
variableanycharacteristicbeingstudiedheight OPAreligionetc variabilityisexpected somearetallhavepetslikegreensing
populationallindividual samplethegroupwe
groupsofindividual wewantinformationabout collectdatafromfew
iiiiiiiii
studentsinaprogram
call student o populationproportion thar pit
that aamainiii.it
parameternumber
numericalsummaries destribesthepopulation thesample
describes p phat
whatwewanttoknow l asanestimate
used
randomsamplingcreatesasamplethatisrepresentativeofthepopulation randomassignmentoftreatmentscreatesgroups
thatareascomparable
randomly
as sotheonly
possible difference
the
between groups isthet reatment treatment
assigning c out
ancels variables trends
uncaused
observational
imii aiiinii i iaiiiimiiiaimeaumresrna
ru prevalenceofbirthdefects evwomanworkedasahairdresser ruhowmuchadiseasespread evamountofdruggiven
simplerandomsample evensoupofsirenhasthesamechanceofselection
sample
stratified populationisgroupedwhereindividualsineath aresimilarbutdifferentbetweengroups sritakenfromeachgroup
cluster
sample populationisdividedintorepresentativegroupsrandomlyselectseveralsurveyeveryindividualinthatgroup
systematicsample usearuleto selectindividual Irandomlyselectthenumber10seeitevery10thindividual ifeng.gg
convenientesample thatareeasytoreach
individuals
survey
voluntaryresponsesample individualschore byrespondingtoa generalinvitation
themselves
randomsimplerandomstratifiedclustersystematic Not randomconvenience voluntaryresponse unrepresentativestrongopinion
Biased amethodthatwillconsistentlyoverestimateorunderestimatethevalueofinterest consistentlytoo highorlowfromthetruth
NonrandomsamplingBias resultsfromnonrandomsampling methodsincludesconvenienceandvoluntaryresponsesamples
under coverage octorswhensomemembersofthepopulationhavenochanceofbeingselected forthesample
ÉÉÉ
NonresponieBias ourswhenanindividualchosenforthesamplecan'tbecontactedorrefusestoparticipate
responsepia whenasamplesurveyproducesasystematicpatternofincorrectresponseswordingofquestionheavilyinfluences
Treatment conditionappliedtothe
specific individualsinanexperiment experimentalunitsselect
individual subjectsindividualsarehuman
controlcomparisonGroup useadesignthat comparetwoormore treatments control placeboaffect
randomization userandomchancetoassigntreatmenttoexperimentalunits balancesconfoundingvariable ÉÉÉÉÉÉ
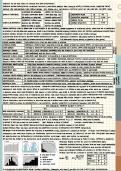
Blindingthestudy experimentalunitsdon'tknowwhat treatmenttheyreceivesingleblindsubjectisunaware doubleblindexperimentertoo
response whatwearemeasuringastheoutcome completelyrandomizedDesigntreatmentsare assignedtoallexperimentalunitsbychance
randomizedBlockDesignusedwhenagroupofexperimentalunitsare knowntobesimilarinsomewaythatwouldaffecttheresponse
differentmathclassesadd variabilityeachsubjectis ablockgroup splitevenlytocompareimprovementhelps andcompare
focusontreatment
matchedpairsDesignspecialtypeofrandomizedblowdesign eachblock consistsofamatchingpairof similar
experimental units 2treatments
randomizedDesign DesignA different liveandwearontheboot matthedPairsDesign DesignB bothbookdothesamethings
scopeofinterferentetypeofinterferenceorconclusion thatcanbedrawnfromastudydeterminedbytypesofrandomness
randomsamplingallowsfor generalizations tothepopulation Randomassignmentoftreatmentsestablishescauseandeffect
wereindividualsrandomlyassignedto
groups
wereindividualsrandom
selectedfromapopulation is in
categoricalvariableplateanindividual
iiii initiation
intooneofseveralcategoriesorgroups Quantitativevariabletakesnumericalvaluestofindanaverage
Discreteif aquantitativevariable'spossiblevalueformasetofseparate numbers10.1.2.31 continuousvaluesformaninterval
numberofpetsthattohaveanexactnumber can'taveragearangeofnumbers weight delimalvaluesarepossible
FrequencyTablelisteach categoryandthefrequencyofindividualsinearncategorynumberofeathanwert
relativefrequencytablelisteachcategoryandtheproportionorpercentofindividualineach category proportion
Bargraphverticalbarsthatdisplaythefrequencyofobservation ineachcategoryofa categoricalvariable piechartcirclepartitionedinwedges
contingency twowayTabledisplaytherelationshipbetweentwocategoricalvariables atvariables Dot plotdotsHistogram barsrange
weoften describe thedistribution
otaayaniitiiiiiiiialaii.liii
wedescribetheshapeofthedistributio mtarai.it Ieiini iim ia'You
reaiesnewnessissummery
meanandmediandescribethecenterofquantitativedata
standardDeviationaveragedistancefromthemean and interquartile
Rangeliar arenumericalsummariesthatdescribe variability
i iii
measure is pp
SD Ʃ 712
IIIiii
mean
E.IE Iron
Sd
distribution quantitativedataisnormalunimodal symmetricbell
shape valueofshasamorepreciseinterpretation
, A
andQuartilesaremeasuresofposition
percentiles
Quartilesdividethedataintoquarters
man
iii iii aiiiaiaiai.in am aaiiiiii identifymodality number
Boxplotscannot ofpeaks
Box showsthis
plot
12 2225 134 363,940ms
his 2
2scorestandardizedscore tellsushowmany
standarddeviationsadatapointisfromitsmean
eitherpositivenegativeorzero
mean
2 Valug
the5numbersummarydividesthedatain4
251ofthedataisineathsection
whendata
storesbelomehigher
meanlincreaselSDdecrease median Iar same
theempiricalruleisforunimodalandsymmetricdata
compared withamericanfamiliesingeneralwould
yourfamilyincomeisbelowabove
yousaythat
average RVhappiness EVincome
2 1.09 servicetimeis1.09JDfasterthanaverage
min28s voluntaryresponseBias pollisunlikelytorepresentthepopulation
IliaL
leftskewed
1in
statisticalproblemsolvingprocessformulatequestionscollectdataanalyzedatainterpretresults researchbroad statisticaldata
variableanycharacteristicbeingstudiedheight OPAreligionetc variabilityisexpected somearetallhavepetslikegreensing
populationallindividual samplethegroupwe
groupsofindividual wewantinformationabout collectdatafromfew
iiiiiiiii
studentsinaprogram
call student o populationproportion thar pit
that aamainiii.it
parameternumber
numericalsummaries destribesthepopulation thesample
describes p phat
whatwewanttoknow l asanestimate
used
randomsamplingcreatesasamplethatisrepresentativeofthepopulation randomassignmentoftreatmentscreatesgroups
thatareascomparable
randomly
as sotheonly
possible difference
the
between groups isthet reatment treatment
assigning c out
ancels variables trends
uncaused
observational
imii aiiinii i iaiiiimiiiaimeaumresrna
ru prevalenceofbirthdefects evwomanworkedasahairdresser ruhowmuchadiseasespread evamountofdruggiven
simplerandomsample evensoupofsirenhasthesamechanceofselection
sample
stratified populationisgroupedwhereindividualsineath aresimilarbutdifferentbetweengroups sritakenfromeachgroup
cluster
sample populationisdividedintorepresentativegroupsrandomlyselectseveralsurveyeveryindividualinthatgroup
systematicsample usearuleto selectindividual Irandomlyselectthenumber10seeitevery10thindividual ifeng.gg
convenientesample thatareeasytoreach
individuals
survey
voluntaryresponsesample individualschore byrespondingtoa generalinvitation
themselves
randomsimplerandomstratifiedclustersystematic Not randomconvenience voluntaryresponse unrepresentativestrongopinion
Biased amethodthatwillconsistentlyoverestimateorunderestimatethevalueofinterest consistentlytoo highorlowfromthetruth
NonrandomsamplingBias resultsfromnonrandomsampling methodsincludesconvenienceandvoluntaryresponsesamples
under coverage octorswhensomemembersofthepopulationhavenochanceofbeingselected forthesample
ÉÉÉ
NonresponieBias ourswhenanindividualchosenforthesamplecan'tbecontactedorrefusestoparticipate
responsepia whenasamplesurveyproducesasystematicpatternofincorrectresponseswordingofquestionheavilyinfluences
Treatment conditionappliedtothe
specific individualsinanexperiment experimentalunitsselect
individual subjectsindividualsarehuman
controlcomparisonGroup useadesignthat comparetwoormore treatments control placeboaffect
randomization userandomchancetoassigntreatmenttoexperimentalunits balancesconfoundingvariable ÉÉÉÉÉÉ
Blindingthestudy experimentalunitsdon'tknowwhat treatmenttheyreceivesingleblindsubjectisunaware doubleblindexperimentertoo
response whatwearemeasuringastheoutcome completelyrandomizedDesigntreatmentsare assignedtoallexperimentalunitsbychance
randomizedBlockDesignusedwhenagroupofexperimentalunitsare knowntobesimilarinsomewaythatwouldaffecttheresponse
differentmathclassesadd variabilityeachsubjectis ablockgroup splitevenlytocompareimprovementhelps andcompare
focusontreatment
matchedpairsDesignspecialtypeofrandomizedblowdesign eachblock consistsofamatchingpairof similar
experimental units 2treatments
randomizedDesign DesignA different liveandwearontheboot matthedPairsDesign DesignB bothbookdothesamethings
scopeofinterferentetypeofinterferenceorconclusion thatcanbedrawnfromastudydeterminedbytypesofrandomness
randomsamplingallowsfor generalizations tothepopulation Randomassignmentoftreatmentsestablishescauseandeffect
wereindividualsrandomlyassignedto
groups
wereindividualsrandom
selectedfromapopulation is in
categoricalvariableplateanindividual
iiii initiation
intooneofseveralcategoriesorgroups Quantitativevariabletakesnumericalvaluestofindanaverage
Discreteif aquantitativevariable'spossiblevalueformasetofseparate numbers10.1.2.31 continuousvaluesformaninterval
numberofpetsthattohaveanexactnumber can'taveragearangeofnumbers weight delimalvaluesarepossible
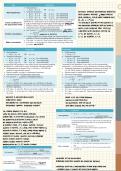
FrequencyTablelisteach categoryandthefrequencyofindividualsinearncategorynumberofeathanwert
relativefrequencytablelisteachcategoryandtheproportionorpercentofindividualineach category proportion
Bargraphverticalbarsthatdisplaythefrequencyofobservation ineachcategoryofa categoricalvariable piechartcirclepartitionedinwedges
contingency twowayTabledisplaytherelationshipbetweentwocategoricalvariables atvariables Dot plotdotsHistogram barsrange
weoften describe thedistribution
otaayaniitiiiiiiiialaii.liii
wedescribetheshapeofthedistributio mtarai.it Ieiini iim ia'You
reaiesnewnessissummery
meanandmediandescribethecenterofquantitativedata
standardDeviationaveragedistancefromthemean and interquartile
Rangeliar arenumericalsummariesthatdescribe variability
i iii
measure is pp
SD Ʃ 712
IIIiii
mean
E.IE Iron
Sd
distribution quantitativedataisnormalunimodal symmetricbell
shape valueofshasamorepreciseinterpretation
, A
andQuartilesaremeasuresofposition
percentiles
Quartilesdividethedataintoquarters
man
iii iii aiiiaiaiai.in am aaiiiiii identifymodality number
Boxplotscannot ofpeaks
Box showsthis
plot
12 2225 134 363,940ms
his 2
2scorestandardizedscore tellsushowmany
standarddeviationsadatapointisfromitsmean
eitherpositivenegativeorzero
mean
2 Valug
the5numbersummarydividesthedatain4
251ofthedataisineathsection
whendata
storesbelomehigher
meanlincreaselSDdecrease median Iar same
theempiricalruleisforunimodalandsymmetricdata
compared withamericanfamiliesingeneralwould
yourfamilyincomeisbelowabove
yousaythat
average RVhappiness EVincome
2 1.09 servicetimeis1.09JDfasterthanaverage
min28s voluntaryresponseBias pollisunlikelytorepresentthepopulation
IliaL
leftskewed
1in