Linear Regression Equations week 8
1. Annie owns a tutoring service. For each tutoring session, she charges $75 plus $35 per
hour of work. A linear equation that expresses the total amount of money Annie earns per
tutoring session is y=75+35x. What are the independent and dependent variables? What
is the y-intercept and the slope?
The independent variable (x) is the amount of time Annie tutors. The dependent variable (y) is
the amount, in dollars, Annie earns for a tutoring session.
Annie charges a one-time fee of $75 (this is when x=0), so the y-intercept is 75. Annie
earns $35 for each hour she works, so the slope is 35.
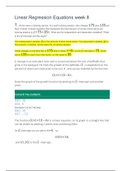
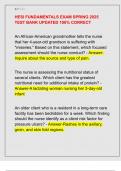
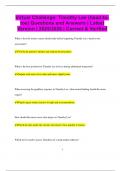
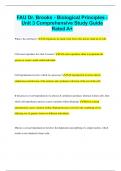
2. George is an avid plant lover and is concerned about the lack of daffodils that
grow in his backyard. He finds the growth of the daffodils, G , is dependent on the
percent of aluminum measured in the soil, x , and can be modeled by the function
G(x)=16−4x.
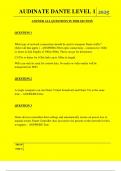
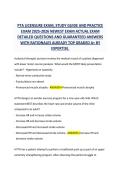
Draw the graph of the growth function by plotting its G -intercept and another
point.
Correct! You nailed it.
$$0, 16
$$4, 0
Example Correct Answer
$$0, 16
$$7, −12
The function G(x)=16−4x is a linear equation, so its graph is a straight line that
can be drawn by plotting 2 points and connecting them.
Its G intercept occurs when x=0, so
G(0)=16,
and (0,16) is the G -intercept.
1. Annie owns a tutoring service. For each tutoring session, she charges $75 plus $35 per
hour of work. A linear equation that expresses the total amount of money Annie earns per
tutoring session is y=75+35x. What are the independent and dependent variables? What
is the y-intercept and the slope?
The independent variable (x) is the amount of time Annie tutors. The dependent variable (y) is
the amount, in dollars, Annie earns for a tutoring session.
Annie charges a one-time fee of $75 (this is when x=0), so the y-intercept is 75. Annie
earns $35 for each hour she works, so the slope is 35.
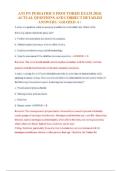
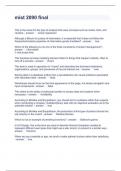
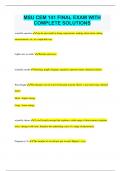
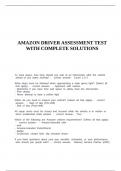
2. George is an avid plant lover and is concerned about the lack of daffodils that
grow in his backyard. He finds the growth of the daffodils, G , is dependent on the
percent of aluminum measured in the soil, x , and can be modeled by the function
G(x)=16−4x.
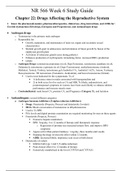
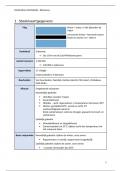
Draw the graph of the growth function by plotting its G -intercept and another
point.
Correct! You nailed it.
$$0, 16
$$4, 0
Example Correct Answer
$$0, 16
$$7, −12
The function G(x)=16−4x is a linear equation, so its graph is a straight line that
can be drawn by plotting 2 points and connecting them.
Its G intercept occurs when x=0, so
G(0)=16,
and (0,16) is the G -intercept.