Quantitative Data Analysis 2
Week 1: Conceptual Models & Analysis of Variance 2
Knowledge Clip 1: Conceptual Models 2
Knowledge Clip 2: ANOVA 3
Lecture 1a: Conceptual Models & Analysis of Variance 5
Lecture 1b: Conceptual Models & Analysis of Variance 12
Week 2: Interaction & Factorial ANOVA 16
Knowledge Clip 1: Introduction Topic 2 16
Knowledge Clip 2: Concept of Interaction 17
Knowledge Clip 3: Factorial ANOVA 19
Lecture 2a: Interaction & Factorial ANOVA 20
Lecture 2b: Interaction & Factorial ANOVA 26
Week 3: Regression Basics 34
Knowledge Clip 1: Concept of Regression 34
Knowledge Clip 2: Regression Testing 35
Lecture 3a: Regression Basics 37
Lecture 3b: Regression Basics 42
Week 4: Midterm Exam Notes 45
Week 5: Regression Complications and Mediation 47
Knowledge Clip 1: Multicollinearity 47
Knowledge Clip 2: Categorical PVs 49
Knowledge Clip 3: Moderation and Mediation in Regression 51
Lecture 4a: Categorical PVs 53
Lecture 4b: Complications in Regression 57
Week 6: Logistic Regression & Hypothesis Formulation 59
Knowledge Clip 1: Concept of Logistic Regression 59
Knowledge Clip 2: Model Fit and Model Testing 61
Lecture 5a: Logistic Regression 63
Lecture 5b: Logistic Regression 67
Week 7: Principal Components Analysis & Reliability Analysis 71
Knowledge Clip 1: Concept of PCA & Initial Checks 71
Knowledge Clip 2: Main Analysis 73
Knowledge Clip 3: Follow-up Analyses 76
Lecture 6a: Principal Components Analysis & Reliability Analysis 81
Lecture 6b: Principal Components Analysis & Reliability Analysis 81
,Quantitative Data Analysis 2
Week 1: Conceptual Models & Analysis of Variance
Knowledge Clip 1: Conceptual Models
• OV = Outcome Variable (Field)
o DV = Dependent Variable → Test variable, variable to be explained
• PV = Predictor Variable (Field)
o IV = Independent Variable → Variable that explains
• PV → OV = IV → DV
• The p-value
o stands for the Probability of obtaining a result (or test-statistic value) equal to (or ‘more
extreme’ than) what was actually observed (the result you actually got), assuming that the
null hypothesis is true
o A low p value indicates that the null hypothesis is unlikely
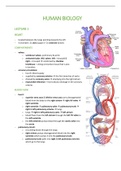
• Conceptual models: Visual representations of relations between theoretical constructs (and variables)
of interest
• In research: by “model” we mean a simplified description of reality
o E.g. predictor variable has an effect on a outcome variable
• Variables can have different measurement scales:
o Categorical (nominal, ordinal) – subgroups are indicated by numbers.
o Quantitative (discrete, interval, ratio) – we use numerical scales, with equal distances
between values → able to run tests on the mean
o In social sciences we often treat ordinal scales as (pseudo) interval scales, e.g. Likert scales →
running tests on them with the mean
• E.g. Research question: What factors influence student satisfaction?
▪ Commitment of teacher
▪ Course content
▪ ...
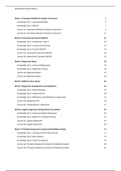
o Conceptual model:
o H1 = Teacher commitment will increase students’
satisfaction level.
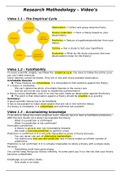
• Moderation/Interaction
o What if our proposed effect is stronger in certain settings?
o H2 = The positive effect of teacher commitment on student satisfaction (H1) is strengthened
by teachers’ level of communication skills.
▪ Teacher commitment is going to have a much larger
effect on student satisfaction if it is backed up by
communication skills.
o “Communication skills” is a moderating variable → one
variable moderates (changes) the relationship between two
other variables.
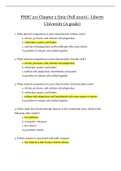
• Mediation
o What if the proposed relationship “goes via” another variable?
o H3 = The positive effect of teachers’ commitment on student
satisfaction is mediated by quality of the course material
o “Course material quality” is a mediating variable → one
variable mediates the relationship between two other
variables.
• Things can get complicated…
o Conceptual models can get complicated, but the following always applies:
▪ The boxes represent variables.
▪ Arrows represent relationships between variables.
• Arrows go from predictor variables to outcome variables.
,Quantitative Data Analysis 2
▪ Hypotheses refer to specific arrows → relationships/effects/differences
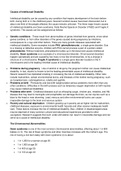
• Conceptual Models and Hypotheses
o Hypotheses are developed a priori: based on theory, previous research
o So not all potential relationships need to be hypothesized
▪ Every hypothesis refers to an arrow in the conceptual model
▪ But not every potential arrow refers to a hypothesis
• (red arrows) – we don’t see any theoretical reason to hypothesize here
o We will still test the effects, but not write hypotheses about them
o A hypothesis is a verbalized expression of an expected relationship between variables (i.e. an
arrow in the conceptual model)
▪ E.g. H1: Attribution of blame to a retail brand is higher in case of a service failure
than when there is no service failure.
▪ E.g. H2: The effect of service failure on attribution (H1) is stronger for the platform
brand than the seller.
• Models/Hypotheses and Analysis
o Appropriate way to test hypotheses depends on:
▪ 1. Nature of the relationship → derived from conceptual model
• Main effects, moderation/interaction, mediation
• (total, direct, indirect effects)
• The kind of relationships established in the conceptual model are a first
indication of the kind of tests that will be run
▪ 2. Nature of the data → not all of this derived from conceptual model as such
• Number of PVs, number of OVs → can be seen in conceptual model
• But, How are variables operationalized? Measured?
• Data type PV(s), data types OV(s)?
• If there are multiple groups: number of groups? relationship between them
((in)dependent)?
▪ Once we figured out nature of relationships and nature of data:
• What is the appropriate statistical analysis to test relationships/
hypotheses?
▪ Only THEN: how do you run the test, what comes out, what does that mean, what
are the implications etc.
Knowledge Clip 2: ANOVA
• But first: flashback to QDA1: Independent Samples T-test!
• When do you use it?
o One OV = Quantitative variable
o One PV = Categorical variable
▪ Number of categories = 2
▪ Participants = Different
• Q: What would we do
if participants = same?
• But what if we had sales figures for
o The Netherlands, UK and Germany? → 3
categories
o Or the Netherlands, UK, Germany, Spain, Italy, France etc.? → 5 categories
o i.e. number of categories = 2 or >2! → use ANOVA!
• ANOVA Basics
, Quantitative Data Analysis 2
o When do we use it?
▪ OV = Quantitative → so we can run tests on the mean
▪ PV = Categorical
• Number of categories = 2 or more!
• Participants = Different
o So independent, mutually exclusive samples!
o A.k.a. Between subjects design
▪ Further assumptions
• Variance is homogenous across groups.
• Residuals are normally distributed (in this class not tested further)
• Groups are roughly equally sized – in this class they usually are.
o NOT adhering to assumptions can produce invalid outcomes!
▪ But SPSS will still let you do it...
• Concepts & Terminology
o Focus
▪ Only 1 PV → One-way ANOVA
▪ Discuss n-way/factorial ANOVA in topic 2 (next week)
▪ Q: So a 3-way ANOVA would imply...?
o NB: Distinguish between
▪ Number of categories within one (categorical) predictor variable
• E.g. PV = gender → multiple categories
▪ Number of (predictor) variables
• E.g. PV gender, PV nationality, PV education level etc.
• ANOVA & F-test
o H0 (as tested in SPSS):
▪ No difference in OV mean across the different categories in PV
• PV with multiple categories, and those categories do
not differ in terms of their OV score
o H1 :
▪ There is at least one difference in OV mean score between PV categories
o Test statistic: F-test
▪ F-distribution looks different than t-distribution
▪ F-values are looking to explain variability
• Procedures are similar to the t-test
o ANOVA decomposes total variability observed in OV (aka DV)
▪ How much is caused by differences between groups?
• (explained variation) → makes sense, variations driven by differences
between groups can be explained by the model
▪ How much is caused by differences within groups?
• (unexplained variation) → multiple observations within the same group
will still differ in terms of the OV
• Variability measures
o Variance = the average of the squared differences from the Mean (average)
▪ Indication of variability
▪ If we have two data points with scores 2 and 3, the mean score = 2.5
(2−2.5)2 +(3−2.5)2
• Hence the variance = = 0.25
2
o Sum of squares = the sum of the squared differences from the Mean (average
o Q: Why do we use squared deviations for Variance?
• Sums of Squares
o Total Sum of Squares =
▪ Squared deviations from grand overall mean
Week 1: Conceptual Models & Analysis of Variance 2
Knowledge Clip 1: Conceptual Models 2
Knowledge Clip 2: ANOVA 3
Lecture 1a: Conceptual Models & Analysis of Variance 5
Lecture 1b: Conceptual Models & Analysis of Variance 12
Week 2: Interaction & Factorial ANOVA 16
Knowledge Clip 1: Introduction Topic 2 16
Knowledge Clip 2: Concept of Interaction 17
Knowledge Clip 3: Factorial ANOVA 19
Lecture 2a: Interaction & Factorial ANOVA 20
Lecture 2b: Interaction & Factorial ANOVA 26
Week 3: Regression Basics 34
Knowledge Clip 1: Concept of Regression 34
Knowledge Clip 2: Regression Testing 35
Lecture 3a: Regression Basics 37
Lecture 3b: Regression Basics 42
Week 4: Midterm Exam Notes 45
Week 5: Regression Complications and Mediation 47
Knowledge Clip 1: Multicollinearity 47
Knowledge Clip 2: Categorical PVs 49
Knowledge Clip 3: Moderation and Mediation in Regression 51
Lecture 4a: Categorical PVs 53
Lecture 4b: Complications in Regression 57
Week 6: Logistic Regression & Hypothesis Formulation 59
Knowledge Clip 1: Concept of Logistic Regression 59
Knowledge Clip 2: Model Fit and Model Testing 61
Lecture 5a: Logistic Regression 63
Lecture 5b: Logistic Regression 67
Week 7: Principal Components Analysis & Reliability Analysis 71
Knowledge Clip 1: Concept of PCA & Initial Checks 71
Knowledge Clip 2: Main Analysis 73
Knowledge Clip 3: Follow-up Analyses 76
Lecture 6a: Principal Components Analysis & Reliability Analysis 81
Lecture 6b: Principal Components Analysis & Reliability Analysis 81
,Quantitative Data Analysis 2
Week 1: Conceptual Models & Analysis of Variance
Knowledge Clip 1: Conceptual Models
• OV = Outcome Variable (Field)
o DV = Dependent Variable → Test variable, variable to be explained
• PV = Predictor Variable (Field)
o IV = Independent Variable → Variable that explains
• PV → OV = IV → DV
• The p-value
o stands for the Probability of obtaining a result (or test-statistic value) equal to (or ‘more
extreme’ than) what was actually observed (the result you actually got), assuming that the
null hypothesis is true
o A low p value indicates that the null hypothesis is unlikely
• Conceptual models: Visual representations of relations between theoretical constructs (and variables)
of interest
• In research: by “model” we mean a simplified description of reality
o E.g. predictor variable has an effect on a outcome variable
• Variables can have different measurement scales:
o Categorical (nominal, ordinal) – subgroups are indicated by numbers.
o Quantitative (discrete, interval, ratio) – we use numerical scales, with equal distances
between values → able to run tests on the mean
o In social sciences we often treat ordinal scales as (pseudo) interval scales, e.g. Likert scales →
running tests on them with the mean
• E.g. Research question: What factors influence student satisfaction?
▪ Commitment of teacher
▪ Course content
▪ ...
o Conceptual model:
o H1 = Teacher commitment will increase students’
satisfaction level.
• Moderation/Interaction
o What if our proposed effect is stronger in certain settings?
o H2 = The positive effect of teacher commitment on student satisfaction (H1) is strengthened
by teachers’ level of communication skills.
▪ Teacher commitment is going to have a much larger
effect on student satisfaction if it is backed up by
communication skills.
o “Communication skills” is a moderating variable → one
variable moderates (changes) the relationship between two
other variables.
• Mediation
o What if the proposed relationship “goes via” another variable?
o H3 = The positive effect of teachers’ commitment on student
satisfaction is mediated by quality of the course material
o “Course material quality” is a mediating variable → one
variable mediates the relationship between two other
variables.
• Things can get complicated…
o Conceptual models can get complicated, but the following always applies:
▪ The boxes represent variables.
▪ Arrows represent relationships between variables.
• Arrows go from predictor variables to outcome variables.
,Quantitative Data Analysis 2
▪ Hypotheses refer to specific arrows → relationships/effects/differences
• Conceptual Models and Hypotheses
o Hypotheses are developed a priori: based on theory, previous research
o So not all potential relationships need to be hypothesized
▪ Every hypothesis refers to an arrow in the conceptual model
▪ But not every potential arrow refers to a hypothesis
• (red arrows) – we don’t see any theoretical reason to hypothesize here
o We will still test the effects, but not write hypotheses about them
o A hypothesis is a verbalized expression of an expected relationship between variables (i.e. an
arrow in the conceptual model)
▪ E.g. H1: Attribution of blame to a retail brand is higher in case of a service failure
than when there is no service failure.
▪ E.g. H2: The effect of service failure on attribution (H1) is stronger for the platform
brand than the seller.
• Models/Hypotheses and Analysis
o Appropriate way to test hypotheses depends on:
▪ 1. Nature of the relationship → derived from conceptual model
• Main effects, moderation/interaction, mediation
• (total, direct, indirect effects)
• The kind of relationships established in the conceptual model are a first
indication of the kind of tests that will be run
▪ 2. Nature of the data → not all of this derived from conceptual model as such
• Number of PVs, number of OVs → can be seen in conceptual model
• But, How are variables operationalized? Measured?
• Data type PV(s), data types OV(s)?
• If there are multiple groups: number of groups? relationship between them
((in)dependent)?
▪ Once we figured out nature of relationships and nature of data:
• What is the appropriate statistical analysis to test relationships/
hypotheses?
▪ Only THEN: how do you run the test, what comes out, what does that mean, what
are the implications etc.
Knowledge Clip 2: ANOVA
• But first: flashback to QDA1: Independent Samples T-test!
• When do you use it?
o One OV = Quantitative variable
o One PV = Categorical variable
▪ Number of categories = 2
▪ Participants = Different
• Q: What would we do
if participants = same?
• But what if we had sales figures for
o The Netherlands, UK and Germany? → 3
categories
o Or the Netherlands, UK, Germany, Spain, Italy, France etc.? → 5 categories
o i.e. number of categories = 2 or >2! → use ANOVA!
• ANOVA Basics
, Quantitative Data Analysis 2
o When do we use it?
▪ OV = Quantitative → so we can run tests on the mean
▪ PV = Categorical
• Number of categories = 2 or more!
• Participants = Different
o So independent, mutually exclusive samples!
o A.k.a. Between subjects design
▪ Further assumptions
• Variance is homogenous across groups.
• Residuals are normally distributed (in this class not tested further)
• Groups are roughly equally sized – in this class they usually are.
o NOT adhering to assumptions can produce invalid outcomes!
▪ But SPSS will still let you do it...
• Concepts & Terminology
o Focus
▪ Only 1 PV → One-way ANOVA
▪ Discuss n-way/factorial ANOVA in topic 2 (next week)
▪ Q: So a 3-way ANOVA would imply...?
o NB: Distinguish between
▪ Number of categories within one (categorical) predictor variable
• E.g. PV = gender → multiple categories
▪ Number of (predictor) variables
• E.g. PV gender, PV nationality, PV education level etc.
• ANOVA & F-test
o H0 (as tested in SPSS):
▪ No difference in OV mean across the different categories in PV
• PV with multiple categories, and those categories do
not differ in terms of their OV score
o H1 :
▪ There is at least one difference in OV mean score between PV categories
o Test statistic: F-test
▪ F-distribution looks different than t-distribution
▪ F-values are looking to explain variability
• Procedures are similar to the t-test
o ANOVA decomposes total variability observed in OV (aka DV)
▪ How much is caused by differences between groups?
• (explained variation) → makes sense, variations driven by differences
between groups can be explained by the model
▪ How much is caused by differences within groups?
• (unexplained variation) → multiple observations within the same group
will still differ in terms of the OV
• Variability measures
o Variance = the average of the squared differences from the Mean (average)
▪ Indication of variability
▪ If we have two data points with scores 2 and 3, the mean score = 2.5
(2−2.5)2 +(3−2.5)2
• Hence the variance = = 0.25
2
o Sum of squares = the sum of the squared differences from the Mean (average
o Q: Why do we use squared deviations for Variance?
• Sums of Squares
o Total Sum of Squares =
▪ Squared deviations from grand overall mean