Statistiek
Hoofdstuk 2 – Beschrijvende statistiek
2.1 Voorstellen van gegevens
Datamatrix / tabel
Gegevens overzichtelijk weergeven
Rijen: elementen van de steekproef
Kolommen: variabelen
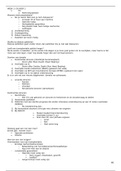
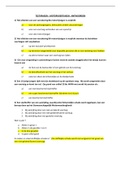
Staafdiagram
Kwalitatieve gegevens klasseren in categorieën
(absolute frequenties): gegevens in elke categorie tellen
Relatieve frequenties: frequenties delen door totaal aantal
gegevens
Frequenties weergeven in staafdiagram
Mogelijke uitkomsten aan x-as
(absolute) frequentie (= hoe vaak komt iets voor?) aan y-as
Relatieve frequentie (= hoe vaak komt een observatie voor in
verhouding met de rest?)
Bv. 18 in verhouding met 44 18/44 = 41%
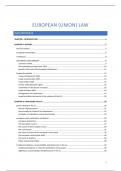
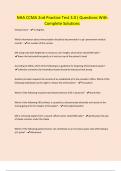
,Pareto-diagram
Categorieën in staafdiagram herschikken volgens dalende frequentie
Gegevens sorteren van groot naar klein
Punten: cumulatieve frequenties = absolute frequentie die je gaat
cumuleren
Bij groep 1 = 18
Bij groep 2 = groep 1 + groep 2 = 18 +9
Bij groep 3 = groep 1 + groep 2 + groep 3 =18 + 9 + 9
…
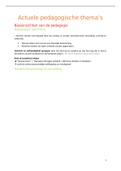
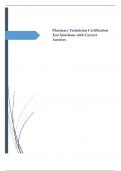
Stengel-en-blad diagram
Gegevens samenvatten met behoud van deelinformatie
Elk getal opsplitsen in 2 delen: stengel en blad
vb. 10.1 → stengel = 10, blad = 1
vb. 10.14 → stengel = 10.1, blad = 4 (hangt er vanaf hoe
gedetailleerd je wil)
Stengels zonder bladeren ook weergeven!
, Deze is misleidend,
compacter, als je er
een staafdiagram van
maakt haal je er niets
uit
Diagram omdraaien?
Staafdiagram
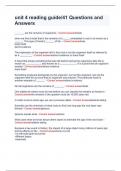
Histogram
“Staafdiagram” voor continue variabelen
Gegevens discreet maken klassen
Klassen zelf kiezen
Meestal even breed
Oppervlakte rechthoek = relatieve frequentie klasse
Totale oppervlakte van alle rechthoeken = 1
Hoofdstuk 2 – Beschrijvende statistiek
2.1 Voorstellen van gegevens
Datamatrix / tabel
Gegevens overzichtelijk weergeven
Rijen: elementen van de steekproef
Kolommen: variabelen
Staafdiagram
Kwalitatieve gegevens klasseren in categorieën
(absolute frequenties): gegevens in elke categorie tellen
Relatieve frequenties: frequenties delen door totaal aantal
gegevens
Frequenties weergeven in staafdiagram
Mogelijke uitkomsten aan x-as
(absolute) frequentie (= hoe vaak komt iets voor?) aan y-as
Relatieve frequentie (= hoe vaak komt een observatie voor in
verhouding met de rest?)
Bv. 18 in verhouding met 44 18/44 = 41%
,Pareto-diagram
Categorieën in staafdiagram herschikken volgens dalende frequentie
Gegevens sorteren van groot naar klein
Punten: cumulatieve frequenties = absolute frequentie die je gaat
cumuleren
Bij groep 1 = 18
Bij groep 2 = groep 1 + groep 2 = 18 +9
Bij groep 3 = groep 1 + groep 2 + groep 3 =18 + 9 + 9
…
Stengel-en-blad diagram
Gegevens samenvatten met behoud van deelinformatie
Elk getal opsplitsen in 2 delen: stengel en blad
vb. 10.1 → stengel = 10, blad = 1
vb. 10.14 → stengel = 10.1, blad = 4 (hangt er vanaf hoe
gedetailleerd je wil)
Stengels zonder bladeren ook weergeven!
, Deze is misleidend,
compacter, als je er
een staafdiagram van
maakt haal je er niets
uit
Diagram omdraaien?
Staafdiagram
Histogram
“Staafdiagram” voor continue variabelen
Gegevens discreet maken klassen
Klassen zelf kiezen
Meestal even breed
Oppervlakte rechthoek = relatieve frequentie klasse
Totale oppervlakte van alle rechthoeken = 1