,SCIENCE SKILLS AND PROCESSES
SCIENTIFIC METHOD
1. Aim: To investigate … the relationship between ( independent variable ) and the ( dependant variable )
2. Hypothesis: Short statement with your guess ( no “I” )
3. Method: Detailed instructions
4. Result: Represented in graph or table
5. Conclusion: summarise main findings, refer to hypothesis being true or not
Independent Variable: Dependant Variable: Controlled Variable: Control Group:
What you change What is being measured What stays the same Nothing is changed
LINE AND BAR GRAPHS
Bar graphs show discontinuous data while Line graphs show continuous data. The line graph also has a plotted
dots that are then joined with a solid line along with a key if 2 lines are involved, but in a bar graph the bars
must be equal width and spacing. But here are some similarities:
- an informative heading including the independent and dependant variables written above the graph and
underlined.
- the independent variable labeled on x-axis ( horizontal ) and dependant variable on y-axis ( vertical ).
- a suitable scale for both y and x axis.
- heading: a table or graph showing the relationship between …
TABLES
NOTE: when working with
- Informative heading with dependant and independent variables.
the scale bar convert mm to
- Independent variable in right column and Dependant variable in left column.
um
- Column heading includes name and units ( no units in the table itself )
FORMULAS:
Calculating Magnification:
Magnification = Draw Size mm
Calculating actual size of magnified specimen:
Size of specimen = drawn size ( mm -> um
I ) X 1000
I
magnification
A M
Actual Size um
=x X 1000 =
ans = um
Calculating Actual Size of Magnified Specimen using Scale Bar:
Actual Size = size on diagram mm * no .
on scale bar
measured length of scale bar mm
= um x 10 x 1 000 x 1 000
Centimeter Millimeter Micrometer Nanometer
( cm ) ( mm ) ( um ) ( nm )
- 10
·
-: 1 000 -: 1 000
, THE RESPIRATORY SYSTEM
Function And Processes
- Provide the body with oxygen and removes the carbon dioxide from the body. The 3 main processes that must
occur:
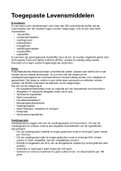
Breathing ( mechanical )
- Inhaling ( oxygen intake ) and exhaling ( removing carbon dioxide )
- Inhaling: intercostal muscles ( between ribs ) contracts and lifts the ribs up while the diaphragm contracts and
flattens. Increases the volume of the chest cavity. Lungs fill with air and alveoli and increase as the elasticity
reduces and volume in lung increases. Decrease in air pressure in lungs so that air pressure in chest and lungs
become equal.
- Exhalation: intercostal muscles relax and diaphragm relax and moves up. This decreases the volume of the
chest cavity. Elasticity increases and causes volume of lungs to decrease. Reduction of chest cavity causes an
increase in air pressure pushing air out of the lungs through the airways. Reduced air pressure in the lungs
allows the air pressure in the chest cavity and lungs to be equal.
Inhaling Exhaling
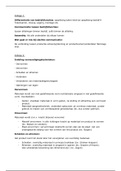
Gaseous Exchange
i
Lungs ( external )
- Exchange of oxygen and carbon through diffusion
- Oxygen diffuses from alveoli ( high concentration ) to blood ( low concentration )
- Carbon diffuses from blood ( high concentration ) into alveoli ( low concentration )
- Diffusion: movement of gas molecules from high concentration to a low concentration
- Happens between alveoli and surrounding capillaries
Blood Capillaries Lung Body Tissue Blood Capillaries
. (I
·
O
CO
O CO
Alveolus
External Gaseous Exchange Internal Gaseous Exchange
SCIENTIFIC METHOD
1. Aim: To investigate … the relationship between ( independent variable ) and the ( dependant variable )
2. Hypothesis: Short statement with your guess ( no “I” )
3. Method: Detailed instructions
4. Result: Represented in graph or table
5. Conclusion: summarise main findings, refer to hypothesis being true or not
Independent Variable: Dependant Variable: Controlled Variable: Control Group:
What you change What is being measured What stays the same Nothing is changed
LINE AND BAR GRAPHS
Bar graphs show discontinuous data while Line graphs show continuous data. The line graph also has a plotted
dots that are then joined with a solid line along with a key if 2 lines are involved, but in a bar graph the bars
must be equal width and spacing. But here are some similarities:
- an informative heading including the independent and dependant variables written above the graph and
underlined.
- the independent variable labeled on x-axis ( horizontal ) and dependant variable on y-axis ( vertical ).
- a suitable scale for both y and x axis.
- heading: a table or graph showing the relationship between …
TABLES
NOTE: when working with
- Informative heading with dependant and independent variables.
the scale bar convert mm to
- Independent variable in right column and Dependant variable in left column.
um
- Column heading includes name and units ( no units in the table itself )
FORMULAS:
Calculating Magnification:
Magnification = Draw Size mm
Calculating actual size of magnified specimen:
Size of specimen = drawn size ( mm -> um
I ) X 1000
I
magnification
A M
Actual Size um
=x X 1000 =
ans = um
Calculating Actual Size of Magnified Specimen using Scale Bar:
Actual Size = size on diagram mm * no .
on scale bar
measured length of scale bar mm
= um x 10 x 1 000 x 1 000
Centimeter Millimeter Micrometer Nanometer
( cm ) ( mm ) ( um ) ( nm )
- 10
·
-: 1 000 -: 1 000
, THE RESPIRATORY SYSTEM
Function And Processes
- Provide the body with oxygen and removes the carbon dioxide from the body. The 3 main processes that must
occur:
Breathing ( mechanical )
- Inhaling ( oxygen intake ) and exhaling ( removing carbon dioxide )
- Inhaling: intercostal muscles ( between ribs ) contracts and lifts the ribs up while the diaphragm contracts and
flattens. Increases the volume of the chest cavity. Lungs fill with air and alveoli and increase as the elasticity
reduces and volume in lung increases. Decrease in air pressure in lungs so that air pressure in chest and lungs
become equal.
- Exhalation: intercostal muscles relax and diaphragm relax and moves up. This decreases the volume of the
chest cavity. Elasticity increases and causes volume of lungs to decrease. Reduction of chest cavity causes an
increase in air pressure pushing air out of the lungs through the airways. Reduced air pressure in the lungs
allows the air pressure in the chest cavity and lungs to be equal.
Inhaling Exhaling
Gaseous Exchange
i
Lungs ( external )
- Exchange of oxygen and carbon through diffusion
- Oxygen diffuses from alveoli ( high concentration ) to blood ( low concentration )
- Carbon diffuses from blood ( high concentration ) into alveoli ( low concentration )
- Diffusion: movement of gas molecules from high concentration to a low concentration
- Happens between alveoli and surrounding capillaries
Blood Capillaries Lung Body Tissue Blood Capillaries
. (I
·
O
CO
O CO
Alveolus
External Gaseous Exchange Internal Gaseous Exchange