Applied Methods and Statistics
ECTURE 1
L
Discover and wonder...
When we look at the world around us, we (oftentimes) observe remarkable differences between people in their skills,
thoughts, in how they behave, how they cope with certain situations, etc.
We also see that psychological characteristics and behaviors often occur together => they correlate (we see patterns)
✓ How do we make these associations visible? (make the patterns visible)
✓ What can we learn from these associations? How does it help us to make better decisions?
✓ How can we explain these differences and associations? Come up with causal explanations
Which underlying causal psychological mechanisms may provide an explanation for differences between individuals
and/or associations?
These are the questions that psychology as a science is concerned with – among other things!
Scientific knowledge for everyday issues...
Science as a basis for everyday issues:
• Will I have fewer negative thoughts if I walk for half an hour every day? Is there a causal link between walking and NT
• If I share my negative thoughts with others, will I have lower risk of cardiovascular disease? Type D personality
• What is the most effective way to learn statistics? • Does mindfulness reduce stress during exams?
• Can you use cognitive tasks to detect dementia at an early stage? • … helps them to maintain their brain
Applied methods and statistics (AMS)
This course provides an in-depth exploration of methods and techniques for investigating (causal) theories related to
psychological processes using empirical data. Extends regression analysis. From theories to statistics
• These theories may span various psychology disciplines, including cognitive and neuropsychology, social and
economic psychology, forensic psychology, developmental psychology, and medical psychology.
• We will focus on how to translate psychological theories (hypotheses) into statistical models, how to apply these
models to empirical research data, and how to derive substantive conclusions from the results. We particularly focus on
the last step – drawing meaningful conclusions – which is often the most challenging. What is the real impact to people,
is the impact the same or should we make subgroups (what does it mean)
• In addition, we will discuss data reduction techniques. We use these techniques to efficiently summarize the data on
larger number of variables and/or to find latent variables underlying test and questionnaire data.
Course overview
Part 1(6 lectures): Causal analysis (testing theories)
How can we describe and explain relationships between multiple variables?
• path analysis (3 lectures) • process analysis (moderation, mediation, and moderated mediation) (3 lectures)
Part 2(4 lectures): Data reduction and dimensionalityanalysis
Analysis of data from tests and questionnaires: Can we reduce the items to a few essential summary scores? Can the
correlations between items be explained by assuming underlying latent psychological attributes?
• principal component analysis (PCA) • explorative factor analysis (EFA)
• confirmative factor analysis (CFA) & structural equation modeling (SEM)
Part 3(1 lecture): How do you choose the appropriatestatistical technique for the research question and available data
envisaged?
• overview of the techniques from the MTO courses: how do you choose the appropriate technique for a given research
question and data collection design?
Part I: Causal analysis
“Correlation is not causation”
Causal explanations for understanding associations between phenomena has been a central concern in humanity for
centuries.
Better understanding means that we are better equipped to shape the world according to our needs and desires (shape
and improve the environment). Take as an example our understanding of the spread of diseases and the subsequent
development of sewage systems for their prevention. Unfortunately, human interventions, while often beneficial, can
also have adverse effects.
1
,It is imperative to remember that correlation does not imply causation—a principle that has been reiterated many times.
The observation that there is an association between two characteristics does not establish a cause-and-effect
relationship. (Not always infer immediately a cause effect relationship)
It is not the crowing of a rooster causing the sun to rise...
How, then, can we rigorously investigate whether a causal relationship exists between two phenomena?
In psychology we mostly study causal relationships through experiments.
The experiment
• Randomly divide the participants into two or more groups (no systematic differences). Since the participants are
assigned completely at random, the groups are comparable on all background characteristics (except for minor
differences due to chance).
• Each group is exposed to a different treatment = manipulation of X (with possibly a control group without intervention)
=> intervention. (manipulation)
• If there are significant differences in Y between groups, there is convincing support for the causal hypothesis
(differences are more than chance level due to random assignment). If the differences are not significant, there is
insufficient evidence for a causal effect (but it cannot be ruled out either! →Never say that if it’s not significant there is
no effect, we just do not have enough evidence to conclude there is an effect
Note! Non-significant does not mean that you have shown that the effect does not exist (!).
It is possible that the effect is there, but it is not found in the study (Type II error) there is an effect but we missed it. The
sample may have been too small to find the effect with sufficient certainty (= little power).
Replication crisis→a lot of type I errors
Remember: absence of evidence ≠ evidence of absence!
Causality and correlation (non-experimental) research
• Random assignment / active manipulation in practice usually not possible, not desirable, or even severely unethical.
Cannot make people depressed for the experiment so we have to rely on correlations
• We have to resort to research with data obtained in ‘natural settings’ (e.g., surveys, observations) => correlational
research.
• Correlational research can be purely observational; that is, just collect data on characteristics of interest and extract
correlational patterns:
✓ Very useful for generating new ideas about possible mechanisms (exploration, generating hypotheses).
✓ Associations can be used to make predictions and use those predictions to improve practice (data science).
• Or theory driven! Explore whether observed correlation patterns support (or refute) existing theoretical ideas about
underlying causal mechanisms (psychological science, causal analyses). Do not collect data but we start with the theory
that we would explain if we collected data, and once we have the theory we collect the data and see if it fits with the
theory we chose
Correlation does not imply causation revisited
When two variables correlate, you cannot simply conclude that there is a causal relationship between the two variables,
but you do not have to rule out a causal effect for sure either! Not take it too strict, correlation can be causal but we don’t
know yet
• When two variables, say X and Y, correlate, there are different mechanisms that can explain the correlation in whole or
in part. Some explanations assume a causal effect between X and Y, others do not.
• Based on the correlation alone, we cannot draw (definite) conclusions which of these mechanisms is most plausible.
But based on theory, some explanations are more plausible than other. We have an argument to build it up
• To learn more about of whether relations are probably causal, we need to include more variables in the analyses to
exclude alternative explanations. This is what we will do in path analyses! Control variables to show the mechanism
behind the correlations
Path Analyses(Causal Analyses)
(Different from before because variables can be dependent or independent)
General set up for causal analysis based on correlations: path analysis:
1. Start by formulating a causal theory describing the presumed causal mechanisms (whereby we rely as much as
possible on what we already know!).
2. Translate the theory into a statistical (causal) model.
2
, . Collect data and estimate the causal effects in the model from empirically observed associations using appropriate
3
statistical methodologies.
4. See to what extent the expected correlations between the variables based on the model correspond to the observed
correlations (are in line with what we expect from our model). If they match, you have support for the model. However, if
the observations do not match the expectations, the model should be adjusted (or possibly) rejected.
De empirical cycle
Next, we will review different explanations for anobserved correlation and see
ow they differ with respect to the causal claims they make.
h
Example: does doing sports make you happy?(simplepath analysis)
Possible explanation 1:directeffect
doing sports → (+) → Happiness
Yes, there is indeed a direct (causal) effect of sports on happiness (see at least a correlation if you collect data)
A direct effect means that if only “doings sports” were to be manipulated (in an experimental setting!*), you would expect
to observe changes in happiness.
Q: Is this a plausible explanation? Is there a sound theoretical basis for a direct effect? (maybe it’s more complex)
* studying differences in happiness of persons who voluntarily decided to do more sports is still observational!
If we change people’s sport activities we would see a change in happiness (manipulating sport activities)
If you just see people volunteering to do more sport are happier it is still observation (no manipulation)
Possible explanation 2:Indirecteffect
Doing sports →(+) production of endorphins→ (+) Happiness
(correlation between these three, can we still say that doing sports causes happiness)
We still think it has a causal effect on happiness because if we force someone to do more sport they are happier, but
now we have an explanation for the causal change
Q1 Is there a causal relationship between sports and happiness according to this model?
Q2 How could you further investigate the validity of this theoretical explanation?
Mediator→it mediates between two variables. But is it really endorphins making the causal link:
Let a group of people exercise and a comparable group not, compare the amount of endorphins in the body
(experimental).
Measure people’s happiness, administer different doses of endorphins to the same people and see if happiness
increases (experimental) (not sure if this will pass the ethical board ;))
Also have to show that doing sports has an effect on endorphins (also need to check the intermediate step)
Explanation 3:there is acommon causeat play
1. Is there a causal relationship assumed between sports and happiness according to this model? No, People with
Q
higher income are happier and do more sport. Doing sport is the effect of income but it will not hange your income.
Income will change your happiness, but being happy does not change your income. No direct or indirect effect of sports
on happiness→ Spurious relationship (not real) = confounding variable (income) in the relationship between sports and
happiness→we have to control for it→put people in different groups based on income (if we see no differences in
happiness the effect is because of income)
Q2. How would you further investigate the validity of this theory?
3
, hat is very difficult! Later on, we will see why. But if we assume that more income leads to more sports, and at the
T
same time increases the feeling of happiness, then we could look at the relationship between sports and happiness
among people with the same income. If the association disappears (or get substantially lower), then we have support for
this theory.
Conclusions
• The previous slides showed three possible explanations for the association between sports and happiness, but there
are undoubtedly other explanations. For example, there may multiple mediators (... long live the creativity and
imagination of the researcher!!!).
• And perhaps in reality, the correlation may be the result of a combination of different causal processes; so part of the
relationship is perhaps caused by mediation via biological processes, and part of the relationship can be 'explained
away' by other variables (health, SES)
• We never know for sure what the reality is, but as we learn more about the relationships with (or while controlling) for
other variables, we can (hopefully) construct increasingly better models with which we can adequately explain the
relationship causally => scientific theory formation.
Take into account other variables and control for them, check what happens to correlations (stronger/weaker)
• Most Important!!! When we look for causal relationships in correlational data, what we really aim for is identifying
confounders; variables that can make two variables appear to be causally related when actually they are not.
Spurious relations
ou do not get sunburns(Y) because you eat icecream(X) (spurious=fake because both caused by sun shine(Z))
Y
Spurious relation between X and Y:
• There is a spurious relationship between X and Y if they have acommon cause(such as variable Z inthe figure
below). There is a third variable (Z) that has a causal effect on both X and Y
• Because both X and Y have the same common cause, there is a correlation between the two variables. But a change
in X has no effect on Y, and nor does a change in Y affect X. The correlation seem to suggest a causal connection
between the variables, but this a spurious result induced by the common cause!
• Variable Z is also called a confounder; it confounds the relationship between X and Y.
Another example of a spurious relationship
Research hypothesis: “Playing video games increases aggression” gaming→ aggression
Is there a causal relationship here, or are there variables that could have a direct effect on both gaming and
aggression?
In other words, are there possible confounders that explain the relationship between gaming and aggression?
Confounders could be gender and age (the 2 usual suspects for confounding)
Gender (z)might be confounding creating a spurious relationship between gaming x and aggression y
If gender is involved, we control of it and then the relationship between X and Y should disappear (gender is a stable
characteristic)
NB: The question of whether there are possible confounders is a question you should always ask yourself! We will come
back to this.
Spurious relations in longitudinal data(and a criticalremark about AI...)
Longitudinal analysis/changes
4
ECTURE 1
L
Discover and wonder...
When we look at the world around us, we (oftentimes) observe remarkable differences between people in their skills,
thoughts, in how they behave, how they cope with certain situations, etc.
We also see that psychological characteristics and behaviors often occur together => they correlate (we see patterns)
✓ How do we make these associations visible? (make the patterns visible)
✓ What can we learn from these associations? How does it help us to make better decisions?
✓ How can we explain these differences and associations? Come up with causal explanations
Which underlying causal psychological mechanisms may provide an explanation for differences between individuals
and/or associations?
These are the questions that psychology as a science is concerned with – among other things!
Scientific knowledge for everyday issues...
Science as a basis for everyday issues:
• Will I have fewer negative thoughts if I walk for half an hour every day? Is there a causal link between walking and NT
• If I share my negative thoughts with others, will I have lower risk of cardiovascular disease? Type D personality
• What is the most effective way to learn statistics? • Does mindfulness reduce stress during exams?
• Can you use cognitive tasks to detect dementia at an early stage? • … helps them to maintain their brain
Applied methods and statistics (AMS)
This course provides an in-depth exploration of methods and techniques for investigating (causal) theories related to
psychological processes using empirical data. Extends regression analysis. From theories to statistics
• These theories may span various psychology disciplines, including cognitive and neuropsychology, social and
economic psychology, forensic psychology, developmental psychology, and medical psychology.
• We will focus on how to translate psychological theories (hypotheses) into statistical models, how to apply these
models to empirical research data, and how to derive substantive conclusions from the results. We particularly focus on
the last step – drawing meaningful conclusions – which is often the most challenging. What is the real impact to people,
is the impact the same or should we make subgroups (what does it mean)
• In addition, we will discuss data reduction techniques. We use these techniques to efficiently summarize the data on
larger number of variables and/or to find latent variables underlying test and questionnaire data.
Course overview
Part 1(6 lectures): Causal analysis (testing theories)
How can we describe and explain relationships between multiple variables?
• path analysis (3 lectures) • process analysis (moderation, mediation, and moderated mediation) (3 lectures)
Part 2(4 lectures): Data reduction and dimensionalityanalysis
Analysis of data from tests and questionnaires: Can we reduce the items to a few essential summary scores? Can the
correlations between items be explained by assuming underlying latent psychological attributes?
• principal component analysis (PCA) • explorative factor analysis (EFA)
• confirmative factor analysis (CFA) & structural equation modeling (SEM)
Part 3(1 lecture): How do you choose the appropriatestatistical technique for the research question and available data
envisaged?
• overview of the techniques from the MTO courses: how do you choose the appropriate technique for a given research
question and data collection design?
Part I: Causal analysis
“Correlation is not causation”
Causal explanations for understanding associations between phenomena has been a central concern in humanity for
centuries.
Better understanding means that we are better equipped to shape the world according to our needs and desires (shape
and improve the environment). Take as an example our understanding of the spread of diseases and the subsequent
development of sewage systems for their prevention. Unfortunately, human interventions, while often beneficial, can
also have adverse effects.
1
,It is imperative to remember that correlation does not imply causation—a principle that has been reiterated many times.
The observation that there is an association between two characteristics does not establish a cause-and-effect
relationship. (Not always infer immediately a cause effect relationship)
It is not the crowing of a rooster causing the sun to rise...
How, then, can we rigorously investigate whether a causal relationship exists between two phenomena?
In psychology we mostly study causal relationships through experiments.
The experiment
• Randomly divide the participants into two or more groups (no systematic differences). Since the participants are
assigned completely at random, the groups are comparable on all background characteristics (except for minor
differences due to chance).
• Each group is exposed to a different treatment = manipulation of X (with possibly a control group without intervention)
=> intervention. (manipulation)
• If there are significant differences in Y between groups, there is convincing support for the causal hypothesis
(differences are more than chance level due to random assignment). If the differences are not significant, there is
insufficient evidence for a causal effect (but it cannot be ruled out either! →Never say that if it’s not significant there is
no effect, we just do not have enough evidence to conclude there is an effect
Note! Non-significant does not mean that you have shown that the effect does not exist (!).
It is possible that the effect is there, but it is not found in the study (Type II error) there is an effect but we missed it. The
sample may have been too small to find the effect with sufficient certainty (= little power).
Replication crisis→a lot of type I errors
Remember: absence of evidence ≠ evidence of absence!
Causality and correlation (non-experimental) research
• Random assignment / active manipulation in practice usually not possible, not desirable, or even severely unethical.
Cannot make people depressed for the experiment so we have to rely on correlations
• We have to resort to research with data obtained in ‘natural settings’ (e.g., surveys, observations) => correlational
research.
• Correlational research can be purely observational; that is, just collect data on characteristics of interest and extract
correlational patterns:
✓ Very useful for generating new ideas about possible mechanisms (exploration, generating hypotheses).
✓ Associations can be used to make predictions and use those predictions to improve practice (data science).
• Or theory driven! Explore whether observed correlation patterns support (or refute) existing theoretical ideas about
underlying causal mechanisms (psychological science, causal analyses). Do not collect data but we start with the theory
that we would explain if we collected data, and once we have the theory we collect the data and see if it fits with the
theory we chose
Correlation does not imply causation revisited
When two variables correlate, you cannot simply conclude that there is a causal relationship between the two variables,
but you do not have to rule out a causal effect for sure either! Not take it too strict, correlation can be causal but we don’t
know yet
• When two variables, say X and Y, correlate, there are different mechanisms that can explain the correlation in whole or
in part. Some explanations assume a causal effect between X and Y, others do not.
• Based on the correlation alone, we cannot draw (definite) conclusions which of these mechanisms is most plausible.
But based on theory, some explanations are more plausible than other. We have an argument to build it up
• To learn more about of whether relations are probably causal, we need to include more variables in the analyses to
exclude alternative explanations. This is what we will do in path analyses! Control variables to show the mechanism
behind the correlations
Path Analyses(Causal Analyses)
(Different from before because variables can be dependent or independent)
General set up for causal analysis based on correlations: path analysis:
1. Start by formulating a causal theory describing the presumed causal mechanisms (whereby we rely as much as
possible on what we already know!).
2. Translate the theory into a statistical (causal) model.
2
, . Collect data and estimate the causal effects in the model from empirically observed associations using appropriate
3
statistical methodologies.
4. See to what extent the expected correlations between the variables based on the model correspond to the observed
correlations (are in line with what we expect from our model). If they match, you have support for the model. However, if
the observations do not match the expectations, the model should be adjusted (or possibly) rejected.
De empirical cycle
Next, we will review different explanations for anobserved correlation and see
ow they differ with respect to the causal claims they make.
h
Example: does doing sports make you happy?(simplepath analysis)
Possible explanation 1:directeffect
doing sports → (+) → Happiness
Yes, there is indeed a direct (causal) effect of sports on happiness (see at least a correlation if you collect data)
A direct effect means that if only “doings sports” were to be manipulated (in an experimental setting!*), you would expect
to observe changes in happiness.
Q: Is this a plausible explanation? Is there a sound theoretical basis for a direct effect? (maybe it’s more complex)
* studying differences in happiness of persons who voluntarily decided to do more sports is still observational!
If we change people’s sport activities we would see a change in happiness (manipulating sport activities)
If you just see people volunteering to do more sport are happier it is still observation (no manipulation)
Possible explanation 2:Indirecteffect
Doing sports →(+) production of endorphins→ (+) Happiness
(correlation between these three, can we still say that doing sports causes happiness)
We still think it has a causal effect on happiness because if we force someone to do more sport they are happier, but
now we have an explanation for the causal change
Q1 Is there a causal relationship between sports and happiness according to this model?
Q2 How could you further investigate the validity of this theoretical explanation?
Mediator→it mediates between two variables. But is it really endorphins making the causal link:
Let a group of people exercise and a comparable group not, compare the amount of endorphins in the body
(experimental).
Measure people’s happiness, administer different doses of endorphins to the same people and see if happiness
increases (experimental) (not sure if this will pass the ethical board ;))
Also have to show that doing sports has an effect on endorphins (also need to check the intermediate step)
Explanation 3:there is acommon causeat play
1. Is there a causal relationship assumed between sports and happiness according to this model? No, People with
Q
higher income are happier and do more sport. Doing sport is the effect of income but it will not hange your income.
Income will change your happiness, but being happy does not change your income. No direct or indirect effect of sports
on happiness→ Spurious relationship (not real) = confounding variable (income) in the relationship between sports and
happiness→we have to control for it→put people in different groups based on income (if we see no differences in
happiness the effect is because of income)
Q2. How would you further investigate the validity of this theory?
3
, hat is very difficult! Later on, we will see why. But if we assume that more income leads to more sports, and at the
T
same time increases the feeling of happiness, then we could look at the relationship between sports and happiness
among people with the same income. If the association disappears (or get substantially lower), then we have support for
this theory.
Conclusions
• The previous slides showed three possible explanations for the association between sports and happiness, but there
are undoubtedly other explanations. For example, there may multiple mediators (... long live the creativity and
imagination of the researcher!!!).
• And perhaps in reality, the correlation may be the result of a combination of different causal processes; so part of the
relationship is perhaps caused by mediation via biological processes, and part of the relationship can be 'explained
away' by other variables (health, SES)
• We never know for sure what the reality is, but as we learn more about the relationships with (or while controlling) for
other variables, we can (hopefully) construct increasingly better models with which we can adequately explain the
relationship causally => scientific theory formation.
Take into account other variables and control for them, check what happens to correlations (stronger/weaker)
• Most Important!!! When we look for causal relationships in correlational data, what we really aim for is identifying
confounders; variables that can make two variables appear to be causally related when actually they are not.
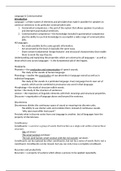
Spurious relations
ou do not get sunburns(Y) because you eat icecream(X) (spurious=fake because both caused by sun shine(Z))
Y
Spurious relation between X and Y:
• There is a spurious relationship between X and Y if they have acommon cause(such as variable Z inthe figure
below). There is a third variable (Z) that has a causal effect on both X and Y
• Because both X and Y have the same common cause, there is a correlation between the two variables. But a change
in X has no effect on Y, and nor does a change in Y affect X. The correlation seem to suggest a causal connection
between the variables, but this a spurious result induced by the common cause!
• Variable Z is also called a confounder; it confounds the relationship between X and Y.
Another example of a spurious relationship
Research hypothesis: “Playing video games increases aggression” gaming→ aggression
Is there a causal relationship here, or are there variables that could have a direct effect on both gaming and
aggression?
In other words, are there possible confounders that explain the relationship between gaming and aggression?
Confounders could be gender and age (the 2 usual suspects for confounding)
Gender (z)might be confounding creating a spurious relationship between gaming x and aggression y
If gender is involved, we control of it and then the relationship between X and Y should disappear (gender is a stable
characteristic)
NB: The question of whether there are possible confounders is a question you should always ask yourself! We will come
back to this.
Spurious relations in longitudinal data(and a criticalremark about AI...)
Longitudinal analysis/changes
4