ASM 275: Lab 2 Final Test With
Correct Answers.
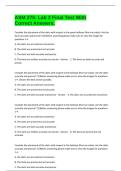
Consider the placement of the darts with respect to the green bullseye (the true value). Are the
darts accurate and precise? [3] Before answering please make sure to view the images for
questions 1-4.
A. the darts are accurate but not precise
B. The darts are precise but not accurate
C. The darts are both accurate and precise
D. The darts are neither accurate nor precise - Answer C. The darts are both accurate and
precise
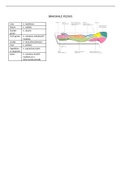
Consider the placement of the darts with respect to the bullseye (the true value). Are the darts
accurate and precise? [3] Before answering please make sure to view the images for questions
1-4. Choose the best answer possible.
A. the darts are accurate but not precise
B. The darts are precise but not accurate
C. The darts are both accurate and precise - Answer A. the darts are accurate but not precise
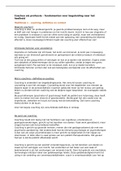
Consider the placement of the darts with respect to the bullseye (the true value). Are the darts
accurate and precise? [3] Before answering please make sure to view the images for questions
1-4.
A. the darts are accurate but not precise
B. The darts are precise but not accurate
C. The darts are both accurate and precise
D. The darts are neither accurate nor precise - Answer B. The darts are precise but not
accurate
Consider the placement of the darts with respect to the bullseye (the true value). Are the darts
accurate and precise? [3] Before answering please make sure to view the images for questions
1-4.
A. the darts are accurate but not precise
B. The darts are precise but not accurate
C. The darts are both accurate and precise
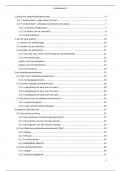
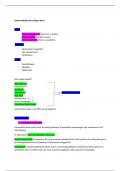
, Here is a dartboard showing the bullseye (the target or true value) and the locations where the
darts were thrown (yellow dots). The bottom image shows a normal distribution where the
horizontal axis represents the measurement value on the dartboard and the vertical axis
represents how common those values are. The vertical line labeled "Reference Value" is directly
beneath the bullseye. This is our TRUE value that we are trying to accurately and precisely
measure. The horizontal line A is the difference between the TRUE value and the MEASURED
value and line B represents how spread out the darts are. In this diagram, lines A and B
represent what? [4]
A. A = Accuracy, B = Precision
B. A = Precision, B = Accuracy - Answer A. A = Accuracy, B = Precision
Based on the above, which diagram represents a more precise measurement set? [4]
A. A
B. B - Answer A. A
There are many ways to reduce inter-observer and intra-observer error. One way is to have the
same observer take measurements at the same time of day with the same calipers. What does
this accomplish?
A. It reduces inter-observer error
B. It reduces intra-observer error. - Answer B. It reduces intra-observer error.
What if two different observers used the exact same measuring equipment to measure different
specimens. This would have what effect?
A. It reduces inter-observer error
B. It reduces intra-observer error - Answer A. It reduces inter-observer error
In the next unit we spend considerable time discussing sexual dimorphism, the fact that men
tend to be larger and more robust than women. Does this apply to the human skull as well? This
is a testable hypothesis: Males have significantly larger skulls than females. [7]
To test this, you measure a sample of male skulls and a sample of female skulls and compare the
mean values to see which is larger. However, the male skulls included in your sample are from
unusually small individuals. Your study suffers from which kind of error?
In making your choice consider whether the error amounts to minor statistical errors (random)
or seems insurmountable (bias).
A. Random error
Correct Answers.
Consider the placement of the darts with respect to the green bullseye (the true value). Are the
darts accurate and precise? [3] Before answering please make sure to view the images for
questions 1-4.
A. the darts are accurate but not precise
B. The darts are precise but not accurate
C. The darts are both accurate and precise
D. The darts are neither accurate nor precise - Answer C. The darts are both accurate and
precise
Consider the placement of the darts with respect to the bullseye (the true value). Are the darts
accurate and precise? [3] Before answering please make sure to view the images for questions
1-4. Choose the best answer possible.
A. the darts are accurate but not precise
B. The darts are precise but not accurate
C. The darts are both accurate and precise - Answer A. the darts are accurate but not precise
Consider the placement of the darts with respect to the bullseye (the true value). Are the darts
accurate and precise? [3] Before answering please make sure to view the images for questions
1-4.
A. the darts are accurate but not precise
B. The darts are precise but not accurate
C. The darts are both accurate and precise
D. The darts are neither accurate nor precise - Answer B. The darts are precise but not
accurate
Consider the placement of the darts with respect to the bullseye (the true value). Are the darts
accurate and precise? [3] Before answering please make sure to view the images for questions
1-4.
A. the darts are accurate but not precise
B. The darts are precise but not accurate
C. The darts are both accurate and precise
, Here is a dartboard showing the bullseye (the target or true value) and the locations where the
darts were thrown (yellow dots). The bottom image shows a normal distribution where the
horizontal axis represents the measurement value on the dartboard and the vertical axis
represents how common those values are. The vertical line labeled "Reference Value" is directly
beneath the bullseye. This is our TRUE value that we are trying to accurately and precisely
measure. The horizontal line A is the difference between the TRUE value and the MEASURED
value and line B represents how spread out the darts are. In this diagram, lines A and B
represent what? [4]
A. A = Accuracy, B = Precision
B. A = Precision, B = Accuracy - Answer A. A = Accuracy, B = Precision
Based on the above, which diagram represents a more precise measurement set? [4]
A. A
B. B - Answer A. A
There are many ways to reduce inter-observer and intra-observer error. One way is to have the
same observer take measurements at the same time of day with the same calipers. What does
this accomplish?
A. It reduces inter-observer error
B. It reduces intra-observer error. - Answer B. It reduces intra-observer error.
What if two different observers used the exact same measuring equipment to measure different
specimens. This would have what effect?
A. It reduces inter-observer error
B. It reduces intra-observer error - Answer A. It reduces inter-observer error
In the next unit we spend considerable time discussing sexual dimorphism, the fact that men
tend to be larger and more robust than women. Does this apply to the human skull as well? This
is a testable hypothesis: Males have significantly larger skulls than females. [7]
To test this, you measure a sample of male skulls and a sample of female skulls and compare the
mean values to see which is larger. However, the male skulls included in your sample are from
unusually small individuals. Your study suffers from which kind of error?
In making your choice consider whether the error amounts to minor statistical errors (random)
or seems insurmountable (bias).
A. Random error