ECS3702
ASSIGNMENT 2 SEMESTER 2 2025
UNIQUE NO.
DUE DATE: 22 SEPTEMBER 2025
,QUESTION 2
Problem context and approach (brief): Tariffs raise the domestic price of an imported
good above the world price. The welfare effects are redistributed among three groups:
consumers, domestic producers, and the government; two deadweight losses also
arise. To present the redistribution numerically we must make simple and standard
assumptions about linear demand and supply so areas are computed exactly. The
calculations below assume the world (free-trade) price is 𝑃𝑊 = 10, a specific tariff 𝑡 = 4
is applied (so the domestic price with the tariff is 𝑃𝑇 = 𝑃𝑊 + 𝑡 = 14 ), and the (observed)
quantities at these prices are:
Quantity demanded at free-trade price 𝑄𝑑𝐹𝑇 = 100.
Quantity supplied domestically at free-trade price 𝑄𝑠𝐹𝑇 = 30.
Quantity demanded at tariff price 𝑄𝑑𝑇 = 85.
Quantity supplied domestically at tariff price 𝑄𝑠𝑇 = 45.
These numbers are standard classroom values that come from linear demand and
supply functions and are used here to compute the areas on the tariff diagram precisely.
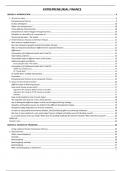
Diagram instructions (for your submission): Draw the standard supply (upward
sloping) and demand (downward sloping) curves. Mark the free-trade horizontal line at
𝑃𝑊 = 10 and the tariff-inclusive domestic price at 𝑃𝑇 = 14. At 𝑃𝑊 read off domestic
supply 𝑄𝑠𝐹𝑇 = 30 and domestic demand 𝑄𝑑𝐹𝑇 = 100. At 𝑃𝑇 read off domestic supply 𝑄𝑠𝑇 =
45 and domestic demand 𝑄𝑑𝑇 = 85. Imports under free trade are 𝑀𝐹𝑇 = 100 − 30 = 70 .
Imports under tariff are 𝑀𝑇 = 85 − 45 = 40 . On the diagram label the standard areas as
follows: the rectangle under the tariff between 𝑄𝑠𝑇 and 𝑄𝑑𝑇 and of height 𝑡 is government
revenue; the rectangle + triangles between the two price lines and the demand/supply
curves mark consumer loss, producer gain and deadweight losses. Use letters if you
prefer (A = producer gain, B = government revenue, C & D = deadweight losses).
Numerical decomposition (areas and algebra):
, 6. Consumer surplus loss (consumers pay a higher price and buy less). Compute
consumer surplus before and after the tariff using triangular areas (inverse
demand intercept implied by the linear demand):
Consumer surplus before tariff (at 𝑃𝑊 = 10, 𝑄𝑑𝐹𝑇 = 100):
𝐶𝑆𝑏𝑒𝑓𝑜𝑟𝑒 = 1 ⁄2 (𝑃𝑚𝑎𝑥 − 𝑃𝑊 ) × 𝑄𝑑𝐹𝑇
(the calculations below use the linear-demand implied choke price; numerically
the area works out to)
𝐶𝑆𝑏𝑒𝑓𝑜𝑟𝑒 = 1333.33.
Consumer surplus after tariff (at 𝑃𝑇 = 14, 𝑄𝑑𝑇 = 85):
𝐶𝑆𝑎𝑓𝑡𝑒𝑟 = 963.33.
Consumer surplus loss = 𝐶𝑆 𝑏𝑒𝑓𝑜𝑟𝑒 − 𝐶𝑆𝑎𝑓𝑡𝑒𝑟 = 1333.33 − 963.33 = 370.
2. Producer surplus gain (domestic producers receive a higher price and supply
more):
Producer surplus before tariff (at 𝑃𝑊 = 10, 𝑄 𝑠𝐹𝑇 = 30) = 120.
Producer surplus after tariff (at 𝑃𝑇 = 14, 𝑄 𝑠𝑇 = 45) = 270.
Producer surplus gain = 270 − 120 = 150.
3. Government tariff revenue (tariff times imports under the tariff):
Revenue = 𝑡 × 𝑀 𝑇 = 4 × (85 − 45) = 4 × 40 = 160.
4. Deadweight losses (DWLs) — two small triangles: production distortion and
consumption distortion.
Production DWL (extra domestic production induced by tariff, inefficient relative
to world price):
Prod DWL = 1 ⁄2 × 𝑡 × (𝑄𝑠𝑇 − 𝑄𝑠𝐹𝑇 ) = 0.5 × 4 × (45 − 30) = 0.5 × 4 × 15 = 30.
Consumption DWL (reduction in consumption due to higher price):
ASSIGNMENT 2 SEMESTER 2 2025
UNIQUE NO.
DUE DATE: 22 SEPTEMBER 2025
,QUESTION 2
Problem context and approach (brief): Tariffs raise the domestic price of an imported
good above the world price. The welfare effects are redistributed among three groups:
consumers, domestic producers, and the government; two deadweight losses also
arise. To present the redistribution numerically we must make simple and standard
assumptions about linear demand and supply so areas are computed exactly. The
calculations below assume the world (free-trade) price is 𝑃𝑊 = 10, a specific tariff 𝑡 = 4
is applied (so the domestic price with the tariff is 𝑃𝑇 = 𝑃𝑊 + 𝑡 = 14 ), and the (observed)
quantities at these prices are:
Quantity demanded at free-trade price 𝑄𝑑𝐹𝑇 = 100.
Quantity supplied domestically at free-trade price 𝑄𝑠𝐹𝑇 = 30.
Quantity demanded at tariff price 𝑄𝑑𝑇 = 85.
Quantity supplied domestically at tariff price 𝑄𝑠𝑇 = 45.
These numbers are standard classroom values that come from linear demand and
supply functions and are used here to compute the areas on the tariff diagram precisely.
Diagram instructions (for your submission): Draw the standard supply (upward
sloping) and demand (downward sloping) curves. Mark the free-trade horizontal line at
𝑃𝑊 = 10 and the tariff-inclusive domestic price at 𝑃𝑇 = 14. At 𝑃𝑊 read off domestic
supply 𝑄𝑠𝐹𝑇 = 30 and domestic demand 𝑄𝑑𝐹𝑇 = 100. At 𝑃𝑇 read off domestic supply 𝑄𝑠𝑇 =
45 and domestic demand 𝑄𝑑𝑇 = 85. Imports under free trade are 𝑀𝐹𝑇 = 100 − 30 = 70 .
Imports under tariff are 𝑀𝑇 = 85 − 45 = 40 . On the diagram label the standard areas as
follows: the rectangle under the tariff between 𝑄𝑠𝑇 and 𝑄𝑑𝑇 and of height 𝑡 is government
revenue; the rectangle + triangles between the two price lines and the demand/supply
curves mark consumer loss, producer gain and deadweight losses. Use letters if you
prefer (A = producer gain, B = government revenue, C & D = deadweight losses).
Numerical decomposition (areas and algebra):
, 6. Consumer surplus loss (consumers pay a higher price and buy less). Compute
consumer surplus before and after the tariff using triangular areas (inverse
demand intercept implied by the linear demand):
Consumer surplus before tariff (at 𝑃𝑊 = 10, 𝑄𝑑𝐹𝑇 = 100):
𝐶𝑆𝑏𝑒𝑓𝑜𝑟𝑒 = 1 ⁄2 (𝑃𝑚𝑎𝑥 − 𝑃𝑊 ) × 𝑄𝑑𝐹𝑇
(the calculations below use the linear-demand implied choke price; numerically
the area works out to)
𝐶𝑆𝑏𝑒𝑓𝑜𝑟𝑒 = 1333.33.
Consumer surplus after tariff (at 𝑃𝑇 = 14, 𝑄𝑑𝑇 = 85):
𝐶𝑆𝑎𝑓𝑡𝑒𝑟 = 963.33.
Consumer surplus loss = 𝐶𝑆 𝑏𝑒𝑓𝑜𝑟𝑒 − 𝐶𝑆𝑎𝑓𝑡𝑒𝑟 = 1333.33 − 963.33 = 370.
2. Producer surplus gain (domestic producers receive a higher price and supply
more):
Producer surplus before tariff (at 𝑃𝑊 = 10, 𝑄 𝑠𝐹𝑇 = 30) = 120.
Producer surplus after tariff (at 𝑃𝑇 = 14, 𝑄 𝑠𝑇 = 45) = 270.
Producer surplus gain = 270 − 120 = 150.
3. Government tariff revenue (tariff times imports under the tariff):
Revenue = 𝑡 × 𝑀 𝑇 = 4 × (85 − 45) = 4 × 40 = 160.
4. Deadweight losses (DWLs) — two small triangles: production distortion and
consumption distortion.
Production DWL (extra domestic production induced by tariff, inefficient relative
to world price):
Prod DWL = 1 ⁄2 × 𝑡 × (𝑄𝑠𝑇 − 𝑄𝑠𝐹𝑇 ) = 0.5 × 4 × (45 − 30) = 0.5 × 4 × 15 = 30.
Consumption DWL (reduction in consumption due to higher price):