OWN SUMMARY MMSR (MAN-MMA032A)
OVERVIEW OF MULTIVARIATE METHODS
Multivariate analysis any simultaneous analysis of more than 2 variables
- Reality: true state of the population. There is either “No difference” (H0 is true) or a
“Difference” (alternative hypothesis, Ha is true).
- Statistical decision: outcome of the hypothesis test. Either rejecting H0 (concluding a
difference exists) or failing to reject H0 (concluding no difference).
Type I error (α) Incorrectly rejecting H0, while H0 is actually true. False positive.
Type II error (β) Failing to reject H0, while Ha is actually true. False negative.
MAR/MCAR
MAR (Missing At Random) missingness depends on observed data but not on the missing
data itself. (e.g. higher income individuals skip salary-related questions).
MCAR (Missing Completely At Random) missingness is unrelated to both observed and
unobserved data. (e.g. data loss due to a random technical issue).
,EXAMINING YOUR DATA
Imputation method process of estimating the missing data of an observation based on
valid values of the other variables. Possibilities:
- Cold-deck imputation from data outside your database
- EM maximum likelihood (MAR = Missing At Random)
- Hot deck imputation from existing observation deemed similar
- Mean substitution substituting by means
- Multiple imputation MAR
- Regression imputation calculating it based on regression models
In case you are not going to replace the data with values, 2 options are possible:
- Complete case approach handling missing data based on complete cases, cases with
no missing data. Also known as the listwise deletion approach.
- All-available approach handling missing data based on all available data, also
known as pairwise approach.
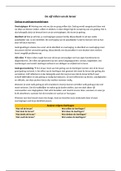
Kurtosis measures the “tailedness” or sharpness of a
distribution’s peak.
High kurtosis (>3) a steep line, heavy tails, more extreme
outliers.
Low kurtosis (<3) is a flatter line, light tails, fewer outliers.
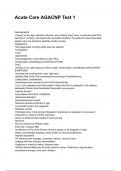
Skewness measures the asymmetry of a distribution
Positive skewness many observations on the left (tail is
longer on the right)
Negative skewness many observations on the right (tail is
longer on the left)
The threshold values for kurtosis and skewness are -3 to +3 (without dividing it by the
standard error)
RULES
How much missing data is too much?
- Over 10%
- Under 10% is acceptable, but assess the MAR/MCAR
, When is a value an outlier?
- For small samples a standard score of 2.5
- For large samples a standard score of 4
- If standard scores are not given, use the threshold values with standard deviations
Normality:
- Above 200 sample size, normality is often okay
- Skewness and kurtosis values between -3 and +3
OVERVIEW OF MULTIVARIATE METHODS
Multivariate analysis any simultaneous analysis of more than 2 variables
- Reality: true state of the population. There is either “No difference” (H0 is true) or a
“Difference” (alternative hypothesis, Ha is true).
- Statistical decision: outcome of the hypothesis test. Either rejecting H0 (concluding a
difference exists) or failing to reject H0 (concluding no difference).
Type I error (α) Incorrectly rejecting H0, while H0 is actually true. False positive.
Type II error (β) Failing to reject H0, while Ha is actually true. False negative.
MAR/MCAR
MAR (Missing At Random) missingness depends on observed data but not on the missing
data itself. (e.g. higher income individuals skip salary-related questions).
MCAR (Missing Completely At Random) missingness is unrelated to both observed and
unobserved data. (e.g. data loss due to a random technical issue).
,EXAMINING YOUR DATA
Imputation method process of estimating the missing data of an observation based on
valid values of the other variables. Possibilities:
- Cold-deck imputation from data outside your database
- EM maximum likelihood (MAR = Missing At Random)
- Hot deck imputation from existing observation deemed similar
- Mean substitution substituting by means
- Multiple imputation MAR
- Regression imputation calculating it based on regression models
In case you are not going to replace the data with values, 2 options are possible:
- Complete case approach handling missing data based on complete cases, cases with
no missing data. Also known as the listwise deletion approach.
- All-available approach handling missing data based on all available data, also
known as pairwise approach.
Kurtosis measures the “tailedness” or sharpness of a
distribution’s peak.
High kurtosis (>3) a steep line, heavy tails, more extreme
outliers.
Low kurtosis (<3) is a flatter line, light tails, fewer outliers.
Skewness measures the asymmetry of a distribution
Positive skewness many observations on the left (tail is
longer on the right)
Negative skewness many observations on the right (tail is
longer on the left)
The threshold values for kurtosis and skewness are -3 to +3 (without dividing it by the
standard error)
RULES
How much missing data is too much?
- Over 10%
- Under 10% is acceptable, but assess the MAR/MCAR
, When is a value an outlier?
- For small samples a standard score of 2.5
- For large samples a standard score of 4
- If standard scores are not given, use the threshold values with standard deviations
Normality:
- Above 200 sample size, normality is often okay
- Skewness and kurtosis values between -3 and +3