Week 1: Introduction
Data-analytics is not new, however the world has changed in the recent years in different area’s
Increased complexity; achieve strategic goals through globalization and advantages of scale
o People have become more demanding; transport products all over the world to buy
relatively low priced products
o Organizations respond and react to the demands through increasing scaling
o Growth, globalization and interdependency among organization to labor
specialization to reach the goals
International companies can’t go without any data, they need data to communicate and to
make sure their internal processes keep functioning (ERP-data, financial data)
Technological developments: Moore’s law; approximately every 18-24 months you’ve got a
doubling of transistor accounts for the same price. This applies to computational power and
technological cost reduction. Other important technological developments;
o Cheaper, faster, higher capacity storage; you can fit more things in the same physical
space, keep more copies of its so it’s more secure, you can find it faster
o Improved connectivity, through networking, internet, 4G/5G and Internet of Things
(part of the internet where appliances are connected to it directly, which allows
them to be changed together and automatic provide service; temperature sensor,
doorbell, coffee maker)
o Development of programming languages of
Machine code to create high-level programming languages; software in the
background that translate it to make it readable and understandable for
machines, which allows us to use libraries or websites
Layered approach, re-use of existing (generic) libraries
Increased value of data
Changing role and expectations of a controller/auditor
Data can provide the answers for the companies problems; with data they can know more about their
customers, how to acquire customers, and understand the market that is not their client.
Paper Geerts (2011): Design Science Research Methodology
Design Science: a different approach to scientific research. It tries to create some sort of structure in
the way of doing research, but by focusing on creation; how are things need to be to obtain goals and
function. The purpose is to change existing situations into preferred situations.
* Design science creates art effects; something that is created by humans typically focus on
relevance and novelty
DSRM; There are 6 different objectives/tipicities described that allows you to structure to studing
something
Digital disruption: companies need to adapts and need to change, otherwise they will go away. Since
2000, 52% of the companies in the S&P 500 index have gone bankrupt, have been acquired or ceased
to exist as a result of digital disruption.
Increased value of data
Organizations that have benefited from the value of data are Alphabet (Google), companies that
works under of billions, companies that offer free service online (the customer is the product),
Amazon, Adyen(platform for online payments), Booking.com, Visa, and advertising companies
(Google, facebook etc)
If you don’t pay for the product, then you (your data) are the product!
1
,Data by itself is maybe over limited value. Analytics can
help you to place data in context and increase the
understanding of it; increase the value of data!
Availability of data: one the one hand you’ve got the
price of the data (value), but on the other hand you’ve got
the quantity of the data
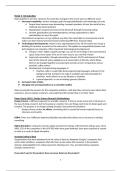
Relationship among people,
process and technology; data is in
the middle, because this is the
input to make people work with
technology in a process in order to
make decisions and take actions,
either manual or technological
Data is either used as an input, data is generated, transformed, used, and outputted. If you add
context to this data and have a better understanding, you create and use value of data
Decisions can be made with a few small, simple, models by including data in there
PDCA-cycle (plan-do-check-act-cycle): First a decisions are made, which leads to either an
action or interaction. This will leads to the use and creation and maybe storage of data (or
not). And then there is an evaluation of what happened that may leads to a new decision
o Data is important; it’s an input for how things work and it’s used to evaluate that the
quality and reliability of data as a key aspect in the decision making
AB-testing; in order to test a feature, you create a copy of the platform with the feature
enabled and watch to see what this new feature does. Based on this you make a decision to
enable this feature for a small group people in the user base, and collect data to see whether
or not this feature has the intended outcomes. After evaluation you decide whether or not to
modify this feature or include it into the whole
Data analytics drivers: the costs for the capture and storage of data are being reduced, while the
value of the data can go up.
Data by itself might not be that valuable, but it might have value to it in the different steps of data;
information, knowledge and wisdom with context and understanding increase the value of the data
Data quality drivers that might influence the base value of the data:
* Availability/scarcity; if data is not available then it’s difficult to value, but if its scares it
maybe have a higher value because its limited
* Quality; completeness, correctness of the data
* Relevancy; is it relevant for what you're looking at?
* Timeliness; in time to make decisions or evaluate processes/outcomes. If the data is not in
time, then you can’t use it; you should shorten the gap of the transformation process
* Reliability; reliability of the underlying process that generated the data
* Integrity; is the data representing what is should represent? Data quality and aspect of data
2
, * Structure; when data is not structured it’s very difficult to get some information out of it
or to transform it to more value information. Unstructured data brings more
complexities
* Completeness
Process flow: from extraction to mining
* Data extraction and query: Excel spreadsheets, reports
* Data analysis: data software package, which allows you to look at larger collections of
data; dashboards
* Data mining: highly sophisticated software that allows you to get a high diagnostic
and predicted value from data; technology automatically tries to extract features and
information from data; find correlations between variables
An auditor/controller needs to become a chameleon to adapt to changes
Fray & Osborn: the impact of computerization on jobs in the US economy. They looked at different
occupations and tasks and determined how easy it is to automate this task. They created a list
ordered by the possibilities for automation for each job. They claim the likelihood for automation.
Paper Vasarhelyi, Kogan and Tuttle: Big Data in Accounting; An Overview (2015)
Big data: the paper gives definitions and tries to link it to the relevance for accounting
‘Corporations, seeking a competitive advantage, have expanded the scope of the information
systems from traditional data processing to automated data capture where they rely on
automated sensing to fully automate their management and production support systems’
o Structured information: someone visit the website and makes an order, as soon as
they put stuff in the basket or make an order it becomes structured information
o Unstructured information: a click stream of data where you have insight in how
many people have visited the website and where they clicked, eye motion tracking
You try to capture data sooner than the accounting records, so you can do something with it;
you’re not missing the people that could not find what they wanted to find, and leave.
Organizations are being given opportunities to capture transactions before their official
accounting recording, identify inventory movement prior to its actual receipt or delivery,
identify customer calls before actual service actions are taken, and many other forms of
economic activity identification
Move from summary data to individual transactions
Technological developments to cost effectively retain this data
Businesses have become global
Dimensions of big data: the paper gives 4 definitions of big data
Hugh volume; a lot of data
Hugh velocity; data is generated/recorded in a fast base; many transaction per day/second
Hugh variety; different types of data, both structured and unstructured data
Uncertain veracity; how sure are we about its liability, reliability and quality? What are you
going to do with the amount of data that you have stored in your data center? How are you
sure that not something is missing or altered? You need to make sure that the quality is there
in order to know that the analysis that are build on this data are reliable as well
Storage is difficult and expensive. The computation is difficult and the scalability depends of specific
tasks. You gather a lot more data and want to make sure that this data is reported timely, so you
need some sort of technology to work with all the data.
3
, Traditionally analyzing all data might not be feasible, this is where algorithms and machine
learning comes; technology that is able to do more high level and more automated things to data
4
Data-analytics is not new, however the world has changed in the recent years in different area’s
Increased complexity; achieve strategic goals through globalization and advantages of scale
o People have become more demanding; transport products all over the world to buy
relatively low priced products
o Organizations respond and react to the demands through increasing scaling
o Growth, globalization and interdependency among organization to labor
specialization to reach the goals
International companies can’t go without any data, they need data to communicate and to
make sure their internal processes keep functioning (ERP-data, financial data)
Technological developments: Moore’s law; approximately every 18-24 months you’ve got a
doubling of transistor accounts for the same price. This applies to computational power and
technological cost reduction. Other important technological developments;
o Cheaper, faster, higher capacity storage; you can fit more things in the same physical
space, keep more copies of its so it’s more secure, you can find it faster
o Improved connectivity, through networking, internet, 4G/5G and Internet of Things
(part of the internet where appliances are connected to it directly, which allows
them to be changed together and automatic provide service; temperature sensor,
doorbell, coffee maker)
o Development of programming languages of
Machine code to create high-level programming languages; software in the
background that translate it to make it readable and understandable for
machines, which allows us to use libraries or websites
Layered approach, re-use of existing (generic) libraries
Increased value of data
Changing role and expectations of a controller/auditor
Data can provide the answers for the companies problems; with data they can know more about their
customers, how to acquire customers, and understand the market that is not their client.
Paper Geerts (2011): Design Science Research Methodology
Design Science: a different approach to scientific research. It tries to create some sort of structure in
the way of doing research, but by focusing on creation; how are things need to be to obtain goals and
function. The purpose is to change existing situations into preferred situations.
* Design science creates art effects; something that is created by humans typically focus on
relevance and novelty
DSRM; There are 6 different objectives/tipicities described that allows you to structure to studing
something
Digital disruption: companies need to adapts and need to change, otherwise they will go away. Since
2000, 52% of the companies in the S&P 500 index have gone bankrupt, have been acquired or ceased
to exist as a result of digital disruption.
Increased value of data
Organizations that have benefited from the value of data are Alphabet (Google), companies that
works under of billions, companies that offer free service online (the customer is the product),
Amazon, Adyen(platform for online payments), Booking.com, Visa, and advertising companies
(Google, facebook etc)
If you don’t pay for the product, then you (your data) are the product!
1
,Data by itself is maybe over limited value. Analytics can
help you to place data in context and increase the
understanding of it; increase the value of data!
Availability of data: one the one hand you’ve got the
price of the data (value), but on the other hand you’ve got
the quantity of the data
Relationship among people,
process and technology; data is in
the middle, because this is the
input to make people work with
technology in a process in order to
make decisions and take actions,
either manual or technological
Data is either used as an input, data is generated, transformed, used, and outputted. If you add
context to this data and have a better understanding, you create and use value of data
Decisions can be made with a few small, simple, models by including data in there
PDCA-cycle (plan-do-check-act-cycle): First a decisions are made, which leads to either an
action or interaction. This will leads to the use and creation and maybe storage of data (or
not). And then there is an evaluation of what happened that may leads to a new decision
o Data is important; it’s an input for how things work and it’s used to evaluate that the
quality and reliability of data as a key aspect in the decision making
AB-testing; in order to test a feature, you create a copy of the platform with the feature
enabled and watch to see what this new feature does. Based on this you make a decision to
enable this feature for a small group people in the user base, and collect data to see whether
or not this feature has the intended outcomes. After evaluation you decide whether or not to
modify this feature or include it into the whole
Data analytics drivers: the costs for the capture and storage of data are being reduced, while the
value of the data can go up.
Data by itself might not be that valuable, but it might have value to it in the different steps of data;
information, knowledge and wisdom with context and understanding increase the value of the data
Data quality drivers that might influence the base value of the data:
* Availability/scarcity; if data is not available then it’s difficult to value, but if its scares it
maybe have a higher value because its limited
* Quality; completeness, correctness of the data
* Relevancy; is it relevant for what you're looking at?
* Timeliness; in time to make decisions or evaluate processes/outcomes. If the data is not in
time, then you can’t use it; you should shorten the gap of the transformation process
* Reliability; reliability of the underlying process that generated the data
* Integrity; is the data representing what is should represent? Data quality and aspect of data
2
, * Structure; when data is not structured it’s very difficult to get some information out of it
or to transform it to more value information. Unstructured data brings more
complexities
* Completeness
Process flow: from extraction to mining
* Data extraction and query: Excel spreadsheets, reports
* Data analysis: data software package, which allows you to look at larger collections of
data; dashboards
* Data mining: highly sophisticated software that allows you to get a high diagnostic
and predicted value from data; technology automatically tries to extract features and
information from data; find correlations between variables
An auditor/controller needs to become a chameleon to adapt to changes
Fray & Osborn: the impact of computerization on jobs in the US economy. They looked at different
occupations and tasks and determined how easy it is to automate this task. They created a list
ordered by the possibilities for automation for each job. They claim the likelihood for automation.
Paper Vasarhelyi, Kogan and Tuttle: Big Data in Accounting; An Overview (2015)
Big data: the paper gives definitions and tries to link it to the relevance for accounting
‘Corporations, seeking a competitive advantage, have expanded the scope of the information
systems from traditional data processing to automated data capture where they rely on
automated sensing to fully automate their management and production support systems’
o Structured information: someone visit the website and makes an order, as soon as
they put stuff in the basket or make an order it becomes structured information
o Unstructured information: a click stream of data where you have insight in how
many people have visited the website and where they clicked, eye motion tracking
You try to capture data sooner than the accounting records, so you can do something with it;
you’re not missing the people that could not find what they wanted to find, and leave.
Organizations are being given opportunities to capture transactions before their official
accounting recording, identify inventory movement prior to its actual receipt or delivery,
identify customer calls before actual service actions are taken, and many other forms of
economic activity identification
Move from summary data to individual transactions
Technological developments to cost effectively retain this data
Businesses have become global
Dimensions of big data: the paper gives 4 definitions of big data
Hugh volume; a lot of data
Hugh velocity; data is generated/recorded in a fast base; many transaction per day/second
Hugh variety; different types of data, both structured and unstructured data
Uncertain veracity; how sure are we about its liability, reliability and quality? What are you
going to do with the amount of data that you have stored in your data center? How are you
sure that not something is missing or altered? You need to make sure that the quality is there
in order to know that the analysis that are build on this data are reliable as well
Storage is difficult and expensive. The computation is difficult and the scalability depends of specific
tasks. You gather a lot more data and want to make sure that this data is reported timely, so you
need some sort of technology to work with all the data.
3
, Traditionally analyzing all data might not be feasible, this is where algorithms and machine
learning comes; technology that is able to do more high level and more automated things to data
4