Introductory video lecture – Quick Update on Statistical Analysis
Descriptive statistics / univariate analysis (we look at one variable at a time):
• Examples of univariate analyses are ‘age’ and ‘height’. In a univariate analysis, you would not
look at these two variables at the same time or at the relationship between them. You can
describe patterns found in univariate by looking at the mean, mode, median, range, variance,
minimum, maximum, standard deviation, and quartiles.
• Where are descriptive statistics /
univariate analyses used for?
o Summarization of the dataset
o Central tendency
o Spread
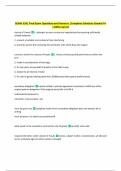
• Scale of variable:
o Non-metric
▪ Nominal variable;
for instance, ‘Big
4’. They are
typically coded
using 0s and 1s.
They measure a
difference. The ‘Big 4’ variable would get the value 1 if a particular firm is a Big 4
firm, and 0 otherwise. The coefficient of this variable then measures the
difference between Big 4 and non-Big 4 firms.
▪ Ordinal variable; for instance, a qualified or unqualified opinion, or a going
concern paragraph in an audit opinion. In this case, qualified could be coded 1,
unqualified 2, and going concern 3. So, it gives some kind of ordering, but it
doesn’t capture the magnitude. The difference between 1 and 2 and between 2
and 3 doesn’t tell you anything about the magnitude; it’s only about the
ordering.
o Metric
▪ Interval/ratio; think, for instance, about audit fees. The total fees a firm pays to
an auditor can only be positive.
o The measures of tendency and spread
are not equally useful for each type of
variable being measured. For instance,
variance and standard deviation
(measurements of spread) are not
relevant for nominal or ordinal
measures. It’s mostly the modus which is
relevant for nominal and ordinal measures. If you look at the metric variables, you can
basically use all the tendency and spread measures. So, it’s important to look at the
measurement level to determine which measures are useful to look at univariate or
descriptive statistics.
,Bivariate analysis (you look at two variables together):
• Bivariate analysis is used to examine
the (non)existence of a relationship
between two different variables.
• If you measure an independent and
dependent variable, or for instance
two independent variables, then
they can both either have a nominal, ordinal, interval, or ratio measurement level. Dependent
on what type of measurement both variables have, you have an applicable method to use, as
can be seen in the table.
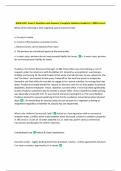
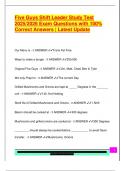
o T-test on the mean; assume you want to
look at the difference in accounting
quality between Big 4 firms and non-Big
4 firms. If an audit is performed by a Big
4 firms, is the quality higher compared to
when it is performed by a non-Big 4 firm?
For this purpose, you do a t-test on the
mean. If you have a small overlap
between the two distributions around the mean, then this indicates that the difference
between the two means is statistically significant.
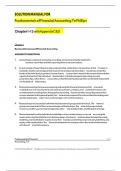
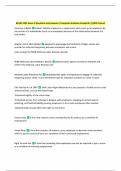
o Correlation table; if
you have nominal,
ordinal, interval, and
ratio variables, then
you typically see that
they both have a
Pearson and Spearman
correlation. You should
always look at the
correlation of the
variable with the lowest level of measurement. So, if one of the variables is ordinal, then
you look at the Spearman’s correlation. If both are metric variables, you can look at
Pearson’s correlation.
Multivariate analysis (you look at a model that includes multiple variables):
• Multivariate analysis is the analysis of three or more variables.
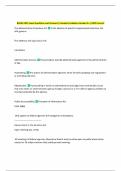
• Typically, we use a linear regression for multivariate analyses. This outcome is depicted in the
table on the next page. You have a dependent variable, which in this case relates to accruals,
and they look at whether audit office size is positively correlated with audit quality. Given that a
greater office means that quality is lower, the predicted sign of the coefficient is negative.
o There are also control variables included. In this case, these variables might also affect
audit quality, but you want to keep them constant in the regression.
, o When you look at a typical
regression, then you see a
coefficient estimate and a p-value.
The coefficient estimate tells you
something about the direction of
the relation between office size
and quality, and the p-value tells
something about the strength of
the relation.
o The adjusted R2 tells you something
about how well the model
performs. It can very between 0
and 1 (or 0% and 100%). The higher
this number (or percentage), the
more variation in accounting quality is explained by the independent variables. In this
specific case, where the adjusted R2 is 0.407, the variables explain about 40% of the
variation in accounting quality.
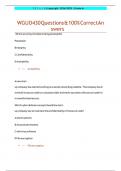
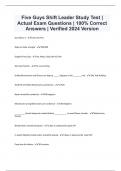
• In the left picture below, there is a low level of strength; the dots, which represent the actual
observations, are (on average) pretty wide from the fitted line. So, the difference between the
dots and where it vertically fits on the line is pretty big. In the picture on the right, there is a
higher level of strength since the dots are closer to the line. It means that the p-value is low, or
actually close to 0.000 (the lower the p-value, the higher the strength of the fitted line).
Video lecture 1 – An Empirical Evaluation of Accounting Income Numbers (Ball & Brown, 1968)
This is actually the paper that started empirical research in accounting.
Brown argued that we need to look at accounting reports as information sources. We need to see
whether these reports are actually used. Do they effect the economic decisions of users of these
reports?
The research question that this papers tries to address is as follows: “Are accounting numbers useful to
investors?” The paper looks both at the content (whether the information in reports is relevant to
investors) and timing (accounting reports are always backward looking; they are issued after the fact) of
usefulness.
Descriptive statistics / univariate analysis (we look at one variable at a time):
• Examples of univariate analyses are ‘age’ and ‘height’. In a univariate analysis, you would not
look at these two variables at the same time or at the relationship between them. You can
describe patterns found in univariate by looking at the mean, mode, median, range, variance,
minimum, maximum, standard deviation, and quartiles.
• Where are descriptive statistics /
univariate analyses used for?
o Summarization of the dataset
o Central tendency
o Spread
• Scale of variable:
o Non-metric
▪ Nominal variable;
for instance, ‘Big
4’. They are
typically coded
using 0s and 1s.
They measure a
difference. The ‘Big 4’ variable would get the value 1 if a particular firm is a Big 4
firm, and 0 otherwise. The coefficient of this variable then measures the
difference between Big 4 and non-Big 4 firms.
▪ Ordinal variable; for instance, a qualified or unqualified opinion, or a going
concern paragraph in an audit opinion. In this case, qualified could be coded 1,
unqualified 2, and going concern 3. So, it gives some kind of ordering, but it
doesn’t capture the magnitude. The difference between 1 and 2 and between 2
and 3 doesn’t tell you anything about the magnitude; it’s only about the
ordering.
o Metric
▪ Interval/ratio; think, for instance, about audit fees. The total fees a firm pays to
an auditor can only be positive.
o The measures of tendency and spread
are not equally useful for each type of
variable being measured. For instance,
variance and standard deviation
(measurements of spread) are not
relevant for nominal or ordinal
measures. It’s mostly the modus which is
relevant for nominal and ordinal measures. If you look at the metric variables, you can
basically use all the tendency and spread measures. So, it’s important to look at the
measurement level to determine which measures are useful to look at univariate or
descriptive statistics.
,Bivariate analysis (you look at two variables together):
• Bivariate analysis is used to examine
the (non)existence of a relationship
between two different variables.
• If you measure an independent and
dependent variable, or for instance
two independent variables, then
they can both either have a nominal, ordinal, interval, or ratio measurement level. Dependent
on what type of measurement both variables have, you have an applicable method to use, as
can be seen in the table.
o T-test on the mean; assume you want to
look at the difference in accounting
quality between Big 4 firms and non-Big
4 firms. If an audit is performed by a Big
4 firms, is the quality higher compared to
when it is performed by a non-Big 4 firm?
For this purpose, you do a t-test on the
mean. If you have a small overlap
between the two distributions around the mean, then this indicates that the difference
between the two means is statistically significant.
o Correlation table; if
you have nominal,
ordinal, interval, and
ratio variables, then
you typically see that
they both have a
Pearson and Spearman
correlation. You should
always look at the
correlation of the
variable with the lowest level of measurement. So, if one of the variables is ordinal, then
you look at the Spearman’s correlation. If both are metric variables, you can look at
Pearson’s correlation.
Multivariate analysis (you look at a model that includes multiple variables):
• Multivariate analysis is the analysis of three or more variables.
• Typically, we use a linear regression for multivariate analyses. This outcome is depicted in the
table on the next page. You have a dependent variable, which in this case relates to accruals,
and they look at whether audit office size is positively correlated with audit quality. Given that a
greater office means that quality is lower, the predicted sign of the coefficient is negative.
o There are also control variables included. In this case, these variables might also affect
audit quality, but you want to keep them constant in the regression.
, o When you look at a typical
regression, then you see a
coefficient estimate and a p-value.
The coefficient estimate tells you
something about the direction of
the relation between office size
and quality, and the p-value tells
something about the strength of
the relation.
o The adjusted R2 tells you something
about how well the model
performs. It can very between 0
and 1 (or 0% and 100%). The higher
this number (or percentage), the
more variation in accounting quality is explained by the independent variables. In this
specific case, where the adjusted R2 is 0.407, the variables explain about 40% of the
variation in accounting quality.
• In the left picture below, there is a low level of strength; the dots, which represent the actual
observations, are (on average) pretty wide from the fitted line. So, the difference between the
dots and where it vertically fits on the line is pretty big. In the picture on the right, there is a
higher level of strength since the dots are closer to the line. It means that the p-value is low, or
actually close to 0.000 (the lower the p-value, the higher the strength of the fitted line).
Video lecture 1 – An Empirical Evaluation of Accounting Income Numbers (Ball & Brown, 1968)
This is actually the paper that started empirical research in accounting.
Brown argued that we need to look at accounting reports as information sources. We need to see
whether these reports are actually used. Do they effect the economic decisions of users of these
reports?
The research question that this papers tries to address is as follows: “Are accounting numbers useful to
investors?” The paper looks both at the content (whether the information in reports is relevant to
investors) and timing (accounting reports are always backward looking; they are issued after the fact) of
usefulness.