Week 5 Lab Assignment
Name:________________________ Instructor Name: _______________
Please use this template to help answer the questions listed in the lab instructions. The
“steps” below refer to the steps listed in the lab instructions. Type your answers and
post your screenshots in the spaces given below. Then, save this document with your
name and submit it inside the course room.
Step 1. Gather Data
Your instructors will post 10 data values to use for this lab. The data values represent
the HEIGHTS of 10 people.
Please reach out to your instructor if you did not receive the assigned 10 data values for
the term by Monday of Week 5.
(NOTE: This is NOT the data used in the lab video, which is about midterm grades. Do
not use the midterm grades data.)
1a. Gather 10 MORE of your own to add to the 10 provided by your instructor. Do the
following: Survey or measure 10 people to find their heights. Determine the mean and
standard deviation for the 20 values by using the Week 3 Excel spreadsheet. (Round
statistics to two decimals.)
Mean Height in Inches 65.7
Sample Standard Deviation in 4.9
inches
Your Height in Inches 63
1
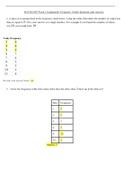
, 1b. Post a screen shot in the space BELOW of the portion of the spreadsheet that
helped you determine these values. Please list the 10 heights your professor provided
first followed by the 10 heights you collected. There should be 20 values to determine
the mean and sample standard deviation.
Lecturer’s heights= 60,63, 65, 66, 66, 67,70, 71,72, 73
My heights= 57, 58, 61, 61, 62, 64, 66, 69, 72, 71
1c. Answer the following two questions (Answer in complete sentences).
How does your height compare to the mean (average) height of the 20 values? Is your
height taller, shorter, or the same as the mean of the sample?
I am 63 inches tall. This makes me shorter than the average individual in my data set.
Step 2. Data Characteristics
Answer the following questions to give some background information on the group of
people you used in your study. Write in complete sentences.
1
Name:________________________ Instructor Name: _______________
Please use this template to help answer the questions listed in the lab instructions. The
“steps” below refer to the steps listed in the lab instructions. Type your answers and
post your screenshots in the spaces given below. Then, save this document with your
name and submit it inside the course room.
Step 1. Gather Data
Your instructors will post 10 data values to use for this lab. The data values represent
the HEIGHTS of 10 people.
Please reach out to your instructor if you did not receive the assigned 10 data values for
the term by Monday of Week 5.
(NOTE: This is NOT the data used in the lab video, which is about midterm grades. Do
not use the midterm grades data.)
1a. Gather 10 MORE of your own to add to the 10 provided by your instructor. Do the
following: Survey or measure 10 people to find their heights. Determine the mean and
standard deviation for the 20 values by using the Week 3 Excel spreadsheet. (Round
statistics to two decimals.)
Mean Height in Inches 65.7
Sample Standard Deviation in 4.9
inches
Your Height in Inches 63
1
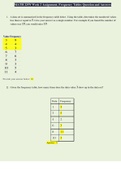
, 1b. Post a screen shot in the space BELOW of the portion of the spreadsheet that
helped you determine these values. Please list the 10 heights your professor provided
first followed by the 10 heights you collected. There should be 20 values to determine
the mean and sample standard deviation.
Lecturer’s heights= 60,63, 65, 66, 66, 67,70, 71,72, 73
My heights= 57, 58, 61, 61, 62, 64, 66, 69, 72, 71
1c. Answer the following two questions (Answer in complete sentences).
How does your height compare to the mean (average) height of the 20 values? Is your
height taller, shorter, or the same as the mean of the sample?
I am 63 inches tall. This makes me shorter than the average individual in my data set.
Step 2. Data Characteristics
Answer the following questions to give some background information on the group of
people you used in your study. Write in complete sentences.
1