AQA Economics Paper 1, Specimen 2014
Ella Bicknell (examiner comments by Peter Cramp)
Context 1
0 1
% change = (£1420 - £1145)/£1145 x 100 = 24.017
Answer: 24.02% (2DP)
Ella’s answer is correct so scores 2/2. Common errors to avoid include forgetting to include
the % sign or not rounding to the two decimal places required in the question. These errors
would both result in a mark of 1/2. Some students might also use the data from the wrong
row of the table, so it is important to check the wording of the question to ensure that you
use the data for “household bills”. Be careful to calculate the change as a percentage of the
original value of £1145 not the new value of £1420
1
,AQA Economics Paper 1, Specimen 2014
Ella Bicknell (examiner comments by Peter Cramp)
0 2
Extract A shows that, while household bills have risen by 24.02% between 2009 and 2013,
the wholesale energy costs per bill have only risen by £20 from £615 to £635. As a
percentage, this is £20/£615 x 100, which is 3.25%. This may indicate that prices are rising
faster than the costs of energy companies, such that firms are not simply passing cost
increases onto their consumers but are exploiting market power to raise prices by a greater
amount.
The fact that the profit per bill has risen over the period from £10 in 2009 to £95 in £2013
also suggests that firms may be exploiting their market power in order to raise their profit
margins.
Ella’s answer scores 4/4. Examples of good exam technique for 4 markers include picking
out key features in the data with dates and numbers. It is important that the data chosen
give an overview of the period, here from 2009 to 2013.
It is often useful to perform your own calculations on the data, as Ella does in her first
paragraph to demonstrate that bills have increased by a greater percentage than wholesale
energy costs.
Where possible, it is a good idea to include two key features of the data that support the
proposition in the question, as Ella has done here, and some simple analysis as she has done
at the end of the first paragraph.
2
,AQA Economics Paper 1, Specimen 2014
Ella Bicknell (examiner comments by Peter Cramp)
0 3
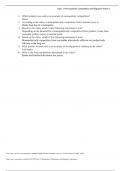
If energy suppliers collude to reduce uncertainty in the markets, they gain price making
power. This allows them to set price or output but not both because they are constrained by
the demand curve. Therefore, they will restrict output (Figure 1: Qm) to the profit
maximising level (MR=MC), by raising prices above the marginal cost of production (Pm).
Profits are shown by the shaded area. Since the demand for energy is price inelastic as it is
considered a necessity, there is likely to be a much higher price charged at the profit
maximising point. The firms can increase retail prices significantly without losing very many
sales. On the other hand, oligopolistic markets that are competitive will see firms producing
high levels of output as they try to undercut each other on price and gain market share,
producing where AR=MC. This produces an outcome similar to that of perfect competition.
Therefore, in conclusion, collusion between energy supplier will increase the retail prices
paid by consumers.
Figure 1: Diagram to show how a
collusive oligopoly in energy
markets will produce a low output
high price combination similar to
that of a monopoly
3
, AQA Economics Paper 1, Specimen 2014
Ella Bicknell (examiner comments by Peter Cramp)
The skills required for answering a 9 marker are knowledge, analysis and application and all
should be in evidence to reach the top level (Level 3) To score top marks there must be a
relevant diagram that is used accurately and appropriately (itself evidence of application)
Ella’s answer is a Level 3 answer, and is most likely to score 8 or 9/9. Her analysis is clear
and correct and the reference to the constraint of the demand curve is good. She could
perhaps have used the phrase “joint monopoly” in relation to collusion under oligopoly but
this is not necessary.
It is useful that Ella has included a title for her diagram, as this helps to show application to
the context of the energy markets. To be sure of full marks it would have been a good idea
for her to show on the diagram the price and output combination that would be produced
under competition, where AR = MC, or, in other words P = MC. However, she has worked
this into her written analysis.
4
Ella Bicknell (examiner comments by Peter Cramp)
Context 1
0 1
% change = (£1420 - £1145)/£1145 x 100 = 24.017
Answer: 24.02% (2DP)
Ella’s answer is correct so scores 2/2. Common errors to avoid include forgetting to include
the % sign or not rounding to the two decimal places required in the question. These errors
would both result in a mark of 1/2. Some students might also use the data from the wrong
row of the table, so it is important to check the wording of the question to ensure that you
use the data for “household bills”. Be careful to calculate the change as a percentage of the
original value of £1145 not the new value of £1420
1
,AQA Economics Paper 1, Specimen 2014
Ella Bicknell (examiner comments by Peter Cramp)
0 2
Extract A shows that, while household bills have risen by 24.02% between 2009 and 2013,
the wholesale energy costs per bill have only risen by £20 from £615 to £635. As a
percentage, this is £20/£615 x 100, which is 3.25%. This may indicate that prices are rising
faster than the costs of energy companies, such that firms are not simply passing cost
increases onto their consumers but are exploiting market power to raise prices by a greater
amount.
The fact that the profit per bill has risen over the period from £10 in 2009 to £95 in £2013
also suggests that firms may be exploiting their market power in order to raise their profit
margins.
Ella’s answer scores 4/4. Examples of good exam technique for 4 markers include picking
out key features in the data with dates and numbers. It is important that the data chosen
give an overview of the period, here from 2009 to 2013.
It is often useful to perform your own calculations on the data, as Ella does in her first
paragraph to demonstrate that bills have increased by a greater percentage than wholesale
energy costs.
Where possible, it is a good idea to include two key features of the data that support the
proposition in the question, as Ella has done here, and some simple analysis as she has done
at the end of the first paragraph.
2
,AQA Economics Paper 1, Specimen 2014
Ella Bicknell (examiner comments by Peter Cramp)
0 3
If energy suppliers collude to reduce uncertainty in the markets, they gain price making
power. This allows them to set price or output but not both because they are constrained by
the demand curve. Therefore, they will restrict output (Figure 1: Qm) to the profit
maximising level (MR=MC), by raising prices above the marginal cost of production (Pm).
Profits are shown by the shaded area. Since the demand for energy is price inelastic as it is
considered a necessity, there is likely to be a much higher price charged at the profit
maximising point. The firms can increase retail prices significantly without losing very many
sales. On the other hand, oligopolistic markets that are competitive will see firms producing
high levels of output as they try to undercut each other on price and gain market share,
producing where AR=MC. This produces an outcome similar to that of perfect competition.
Therefore, in conclusion, collusion between energy supplier will increase the retail prices
paid by consumers.
Figure 1: Diagram to show how a
collusive oligopoly in energy
markets will produce a low output
high price combination similar to
that of a monopoly
3
, AQA Economics Paper 1, Specimen 2014
Ella Bicknell (examiner comments by Peter Cramp)
The skills required for answering a 9 marker are knowledge, analysis and application and all
should be in evidence to reach the top level (Level 3) To score top marks there must be a
relevant diagram that is used accurately and appropriately (itself evidence of application)
Ella’s answer is a Level 3 answer, and is most likely to score 8 or 9/9. Her analysis is clear
and correct and the reference to the constraint of the demand curve is good. She could
perhaps have used the phrase “joint monopoly” in relation to collusion under oligopoly but
this is not necessary.
It is useful that Ella has included a title for her diagram, as this helps to show application to
the context of the energy markets. To be sure of full marks it would have been a good idea
for her to show on the diagram the price and output combination that would be produced
under competition, where AR = MC, or, in other words P = MC. However, she has worked
this into her written analysis.
4