Assignment B
Business game review
[logo]
Author: [name]
Seminar group: B
Team: 3
Word count: 5,461
Date of submission: 7 January 2020
, [company name] - Safety First
[name]
Table of contents
1. Introduction......................................................................................................................... 4
2. Company performance.......................................................................................................5
2.1 Prediction and outcome year 1......................................................................................5
2.2 Prediction and outcome year 2......................................................................................8
2.3 Prediction and outcome year 3....................................................................................11
2.4 Prediction and outcome year 4....................................................................................13
2.5 Trends KPM................................................................................................................ 15
2.5.1 [company name] trends........................................................................................15
2.5.2 Competitors trends...............................................................................................16
3. Learning........................................................................................................................... 20
3.1 Financial Management................................................................................................20
3.2 Marketing.................................................................................................................... 22
3.3 Operations.................................................................................................................. 24
3.4 HRM............................................................................................................................ 26
3.5 Strategy...................................................................................................................... 27
4. Conclusion........................................................................................................................ 28
5. Performance Team........................................................................................................... 29
List of references.................................................................................................................. 32
Attachments......................................................................................................................... 33
Attachment 1 Business objectives [company name].........................................................33
2
, [company name] - Safety First
[name]
Table of figures and tables
Figure 1 Model costs [company name] year 1........................................................................6
Figure 2 Model costs [company name] per car year 2..........................................................10
Figure 3 Profit [company name] year 1 till 4.........................................................................15
Figure 4 Bank balance [company name] year 1 - 4..............................................................16
Figure 5 ROI [company name] and competitors...................................................................17
Figure 6 Post tax profit [company name] and competitors....................................................17
Figure 7 Productivity Index [company name] and competitors..............................................18
Figure 8 Market share [company name] and competitors.....................................................19
Figure 9 Marketing Expenses [company name] year 1 - 4....................................................22
Figure 10 Warranty costs and productivity [company name]................................................25
Figure 11 Training expenses [company name].....................................................................26
Table 1 Business Objectives [company name].......................................................................4
Table 2 Performance [company name] Round 1....................................................................6
Table 3 Round 2 performance [company name].....................................................................9
Table 4 Performance [company name] Round 3..................................................................12
Table 5 Performance [company name] round 4....................................................................14
Table 6 Business objectives [company name] year 1 - 4......................................................28
Table 7 Roles of team members [company name]...............................................................29
3
, [company name] - Safety First
[name]
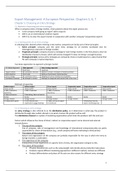
1.Introduction 1
The mission statement of [company name] is formulated as follows “The market leader in
producing distinctive and technically advanced affordable models that offer maximum safety
levels to all occupants”. This vision is based on the value that safety is a central element of
the DNA of the organization.
Based on this vision, the following business objectives have been formulated for the past
four years. The complete description of these targets can be found in Appendix 1. As can be
seen in the table below, several goals have been achieved. The fourth and fifth objective
were not achieved. The requirements for the fourth objective were only met in the second
year. This year is the only year they achieved a percentage above 3%: 3.90%. The fifth
objective is based on de difference in productivity per employee compared to the year
before. In the second year, this was achieved with a percentage of 7.40%.
Table 1 Business Objectives [company name]
Business KPM Round 1 Round 2 Round Round
objective: 3 4
1. Profit after tax (£m) 218 219 332 418
2. Market share (%) 2.50 3.17 4.18 5.21
3. Unsold cars (%) 0.00 0.00 0.00 0.02
4. R&D investment (%) (based on 1.28 3.90 0.52 0.17
revenue)
5. Productivity improvement % 7.44 -9.23 -1.67
(based on productivity per employee
improvement)
Total sales (£m) 2,331 3,058 4,043 4,963
Shareholder funds (£m) 718 937 1,269 1,686
Closing bank balance (£m) 523 334 465 842
Outstanding Loan (£m) 500 238 71 0
Number of employees 2,100 2,500 3,380 4,000
Cars produced 143,560 183,600 225,31 262,21
2 6
Sparkline
Data from April Training Executive was acquired at the end of each year/round indicated. Sparkline based on
round 1 to 4.
1 Parts of assignment A are re-used for the introduction. Assignment A is co-created by the
author of this document.
4
Business game review
[logo]
Author: [name]
Seminar group: B
Team: 3
Word count: 5,461
Date of submission: 7 January 2020
, [company name] - Safety First
[name]
Table of contents
1. Introduction......................................................................................................................... 4
2. Company performance.......................................................................................................5
2.1 Prediction and outcome year 1......................................................................................5
2.2 Prediction and outcome year 2......................................................................................8
2.3 Prediction and outcome year 3....................................................................................11
2.4 Prediction and outcome year 4....................................................................................13
2.5 Trends KPM................................................................................................................ 15
2.5.1 [company name] trends........................................................................................15
2.5.2 Competitors trends...............................................................................................16
3. Learning........................................................................................................................... 20
3.1 Financial Management................................................................................................20
3.2 Marketing.................................................................................................................... 22
3.3 Operations.................................................................................................................. 24
3.4 HRM............................................................................................................................ 26
3.5 Strategy...................................................................................................................... 27
4. Conclusion........................................................................................................................ 28
5. Performance Team........................................................................................................... 29
List of references.................................................................................................................. 32
Attachments......................................................................................................................... 33
Attachment 1 Business objectives [company name].........................................................33
2
, [company name] - Safety First
[name]
Table of figures and tables
Figure 1 Model costs [company name] year 1........................................................................6
Figure 2 Model costs [company name] per car year 2..........................................................10
Figure 3 Profit [company name] year 1 till 4.........................................................................15
Figure 4 Bank balance [company name] year 1 - 4..............................................................16
Figure 5 ROI [company name] and competitors...................................................................17
Figure 6 Post tax profit [company name] and competitors....................................................17
Figure 7 Productivity Index [company name] and competitors..............................................18
Figure 8 Market share [company name] and competitors.....................................................19
Figure 9 Marketing Expenses [company name] year 1 - 4....................................................22
Figure 10 Warranty costs and productivity [company name]................................................25
Figure 11 Training expenses [company name].....................................................................26
Table 1 Business Objectives [company name].......................................................................4
Table 2 Performance [company name] Round 1....................................................................6
Table 3 Round 2 performance [company name].....................................................................9
Table 4 Performance [company name] Round 3..................................................................12
Table 5 Performance [company name] round 4....................................................................14
Table 6 Business objectives [company name] year 1 - 4......................................................28
Table 7 Roles of team members [company name]...............................................................29
3
, [company name] - Safety First
[name]
1.Introduction 1
The mission statement of [company name] is formulated as follows “The market leader in
producing distinctive and technically advanced affordable models that offer maximum safety
levels to all occupants”. This vision is based on the value that safety is a central element of
the DNA of the organization.
Based on this vision, the following business objectives have been formulated for the past
four years. The complete description of these targets can be found in Appendix 1. As can be
seen in the table below, several goals have been achieved. The fourth and fifth objective
were not achieved. The requirements for the fourth objective were only met in the second
year. This year is the only year they achieved a percentage above 3%: 3.90%. The fifth
objective is based on de difference in productivity per employee compared to the year
before. In the second year, this was achieved with a percentage of 7.40%.
Table 1 Business Objectives [company name]
Business KPM Round 1 Round 2 Round Round
objective: 3 4
1. Profit after tax (£m) 218 219 332 418
2. Market share (%) 2.50 3.17 4.18 5.21
3. Unsold cars (%) 0.00 0.00 0.00 0.02
4. R&D investment (%) (based on 1.28 3.90 0.52 0.17
revenue)
5. Productivity improvement % 7.44 -9.23 -1.67
(based on productivity per employee
improvement)
Total sales (£m) 2,331 3,058 4,043 4,963
Shareholder funds (£m) 718 937 1,269 1,686
Closing bank balance (£m) 523 334 465 842
Outstanding Loan (£m) 500 238 71 0
Number of employees 2,100 2,500 3,380 4,000
Cars produced 143,560 183,600 225,31 262,21
2 6
Sparkline
Data from April Training Executive was acquired at the end of each year/round indicated. Sparkline based on
round 1 to 4.
1 Parts of assignment A are re-used for the introduction. Assignment A is co-created by the
author of this document.
4